
OSU ChromaDepth Scientific Visualization Gallery
Mike Bailey, Computer Science
Oregon State University
This page was last updated on: August 8, 2020
What is ChromaDepth?

|
ChromaDepth was invented by Richard Steenblik as a way to amplify the
common chromostereoscopy phenomenon into a useful display tool.
ChromaDepth consists of two pieces: a simple pair of glasses and a display methodology.
The glasses, shown here, contain very thin diffractive optics that have the efficiency of refractive optics. While being very thin and inexpensive, they behave like thicker glass prisms. The lenses are oriented sideways, so the overall bending effect looks like parts of the scene have been shifted horizontally inwards (ie, towards the center of your nose). The red hues are shifted more than the greens and the greens are shifted more than the blues. Thus, red elements in the 3D scene appear to converge closest to the viewer and the blue elements appear to converge the farthest away. The corresponding display methodology is then quite simple: color code the scene in linear a rainbow spectrum based on depth so that those elements that are close to the eye are displayed as red and those farthest away are displayed as blue. You can do this with a computer program. |

|
A ChromaDepth Coloring Book?
You can also do this surprisingly well by just coloring a picture! What's up with that?
Did You Know That You Can Create Dynamic ChromaDepth Interaction From an OpenGL Program?
Click here to see how to do it circa 1999.
We published this paper in 1999, and it shows how one would do dynamic ChromaDepth then.
Today, however, it is easier to do it in a GPU shader.
Here's what that looks like:
And, here's how to do it
with some corrosive noise decimation thrown in for good measure.
(This could probably also be turned into an interesting Maya or 3DS plug-in.)
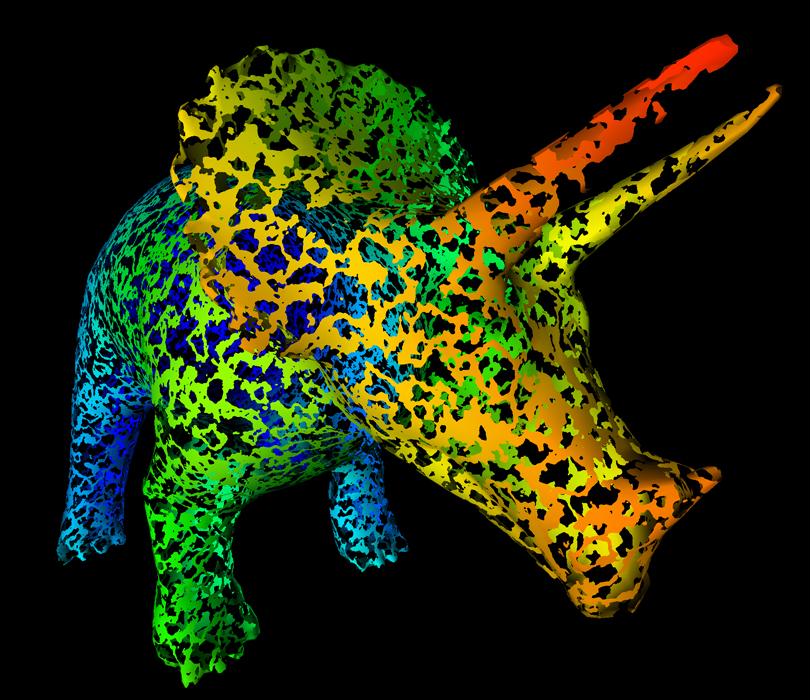
Scientific Visualization ChromaDepth Images
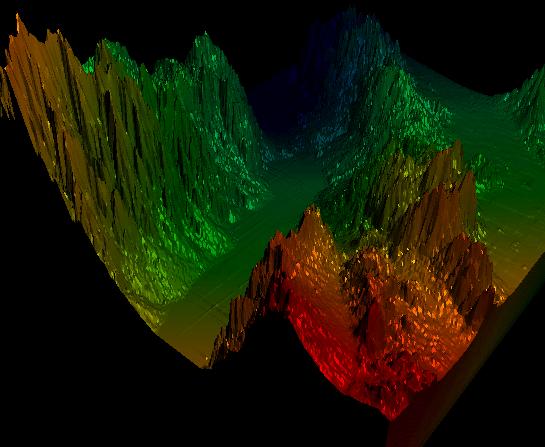
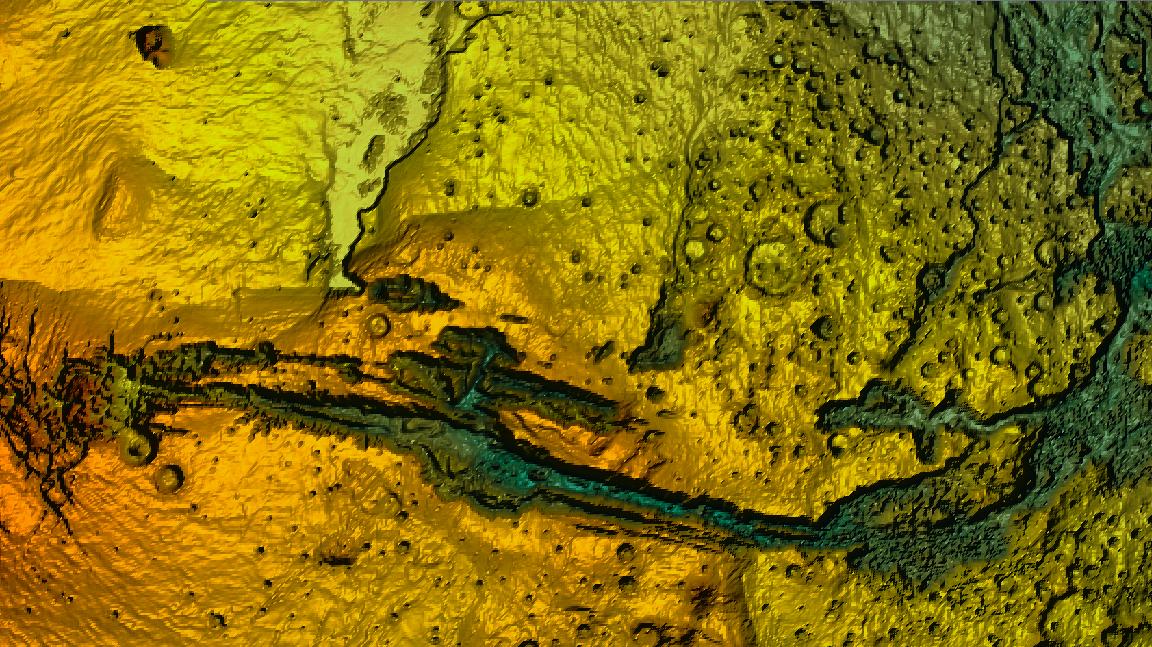
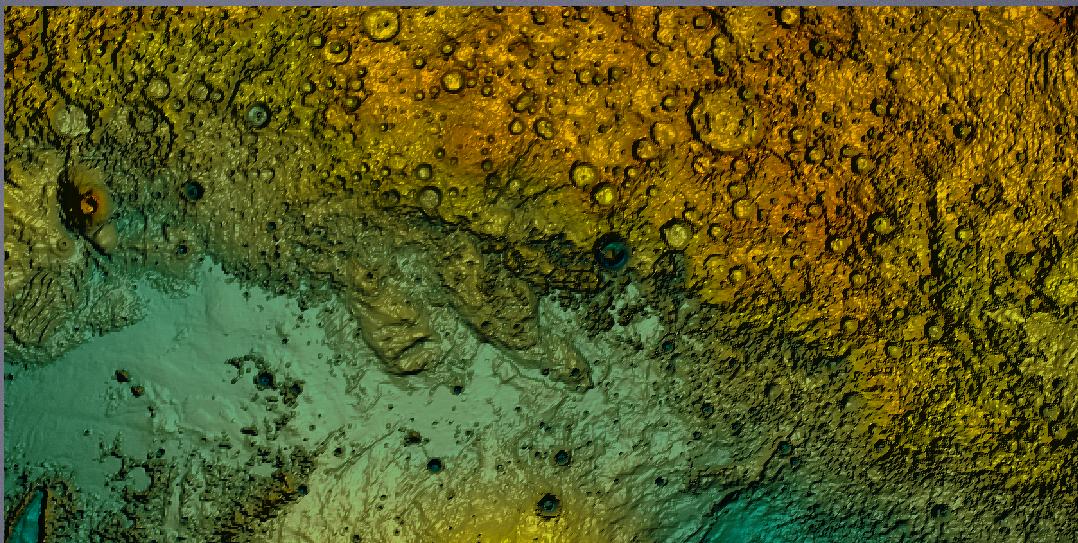
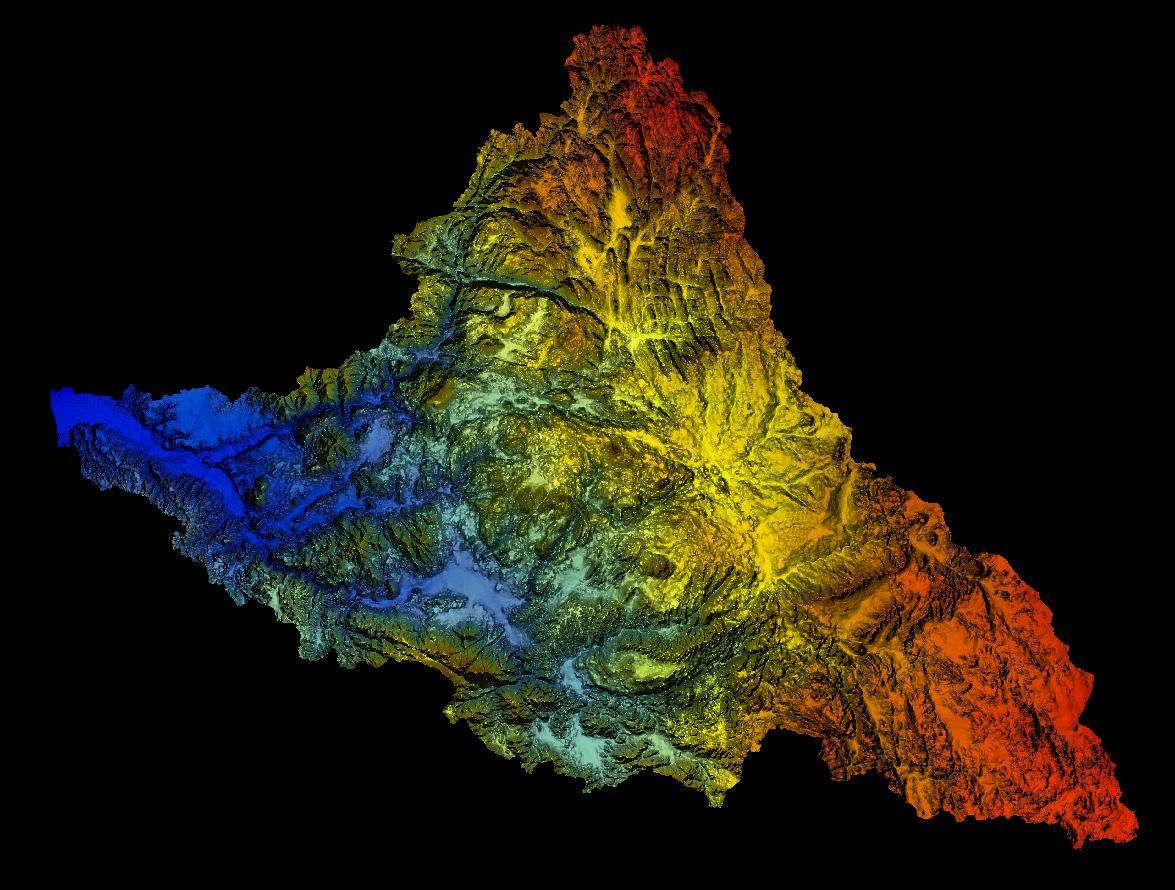
At OSU, we are using ChromaDepth as a means of better understanding scientific data. The following shows a few of those images.
These images are copyrighted (© 2010) by Oregon State University. However, they can be used for anything non-commercial if appropriate credit is given. We love it when school kids get to see these images. Science and engineering are quite fun, if only they are presented as such!
If you do something clever and cool with these images, please let Mike Bailey know at: mjb@cs.oregonstate.edu . I'm always interested!
Click on any thumbnail image to load a larger version. However, if you want to print posters for your own or class use, let me know and I will get you higher-resolution versions of the images.
|
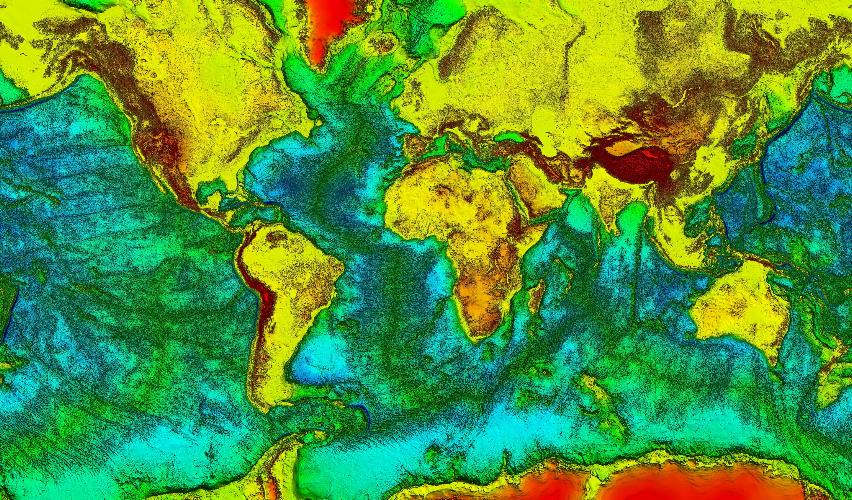
| World Map |
|
|
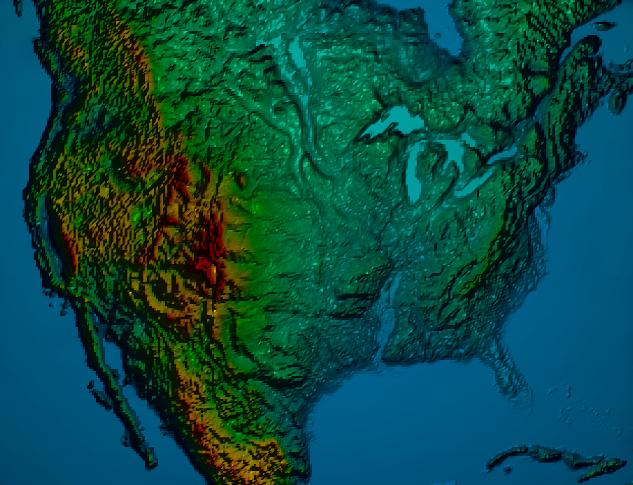
| Continental United States | San Diego |
|
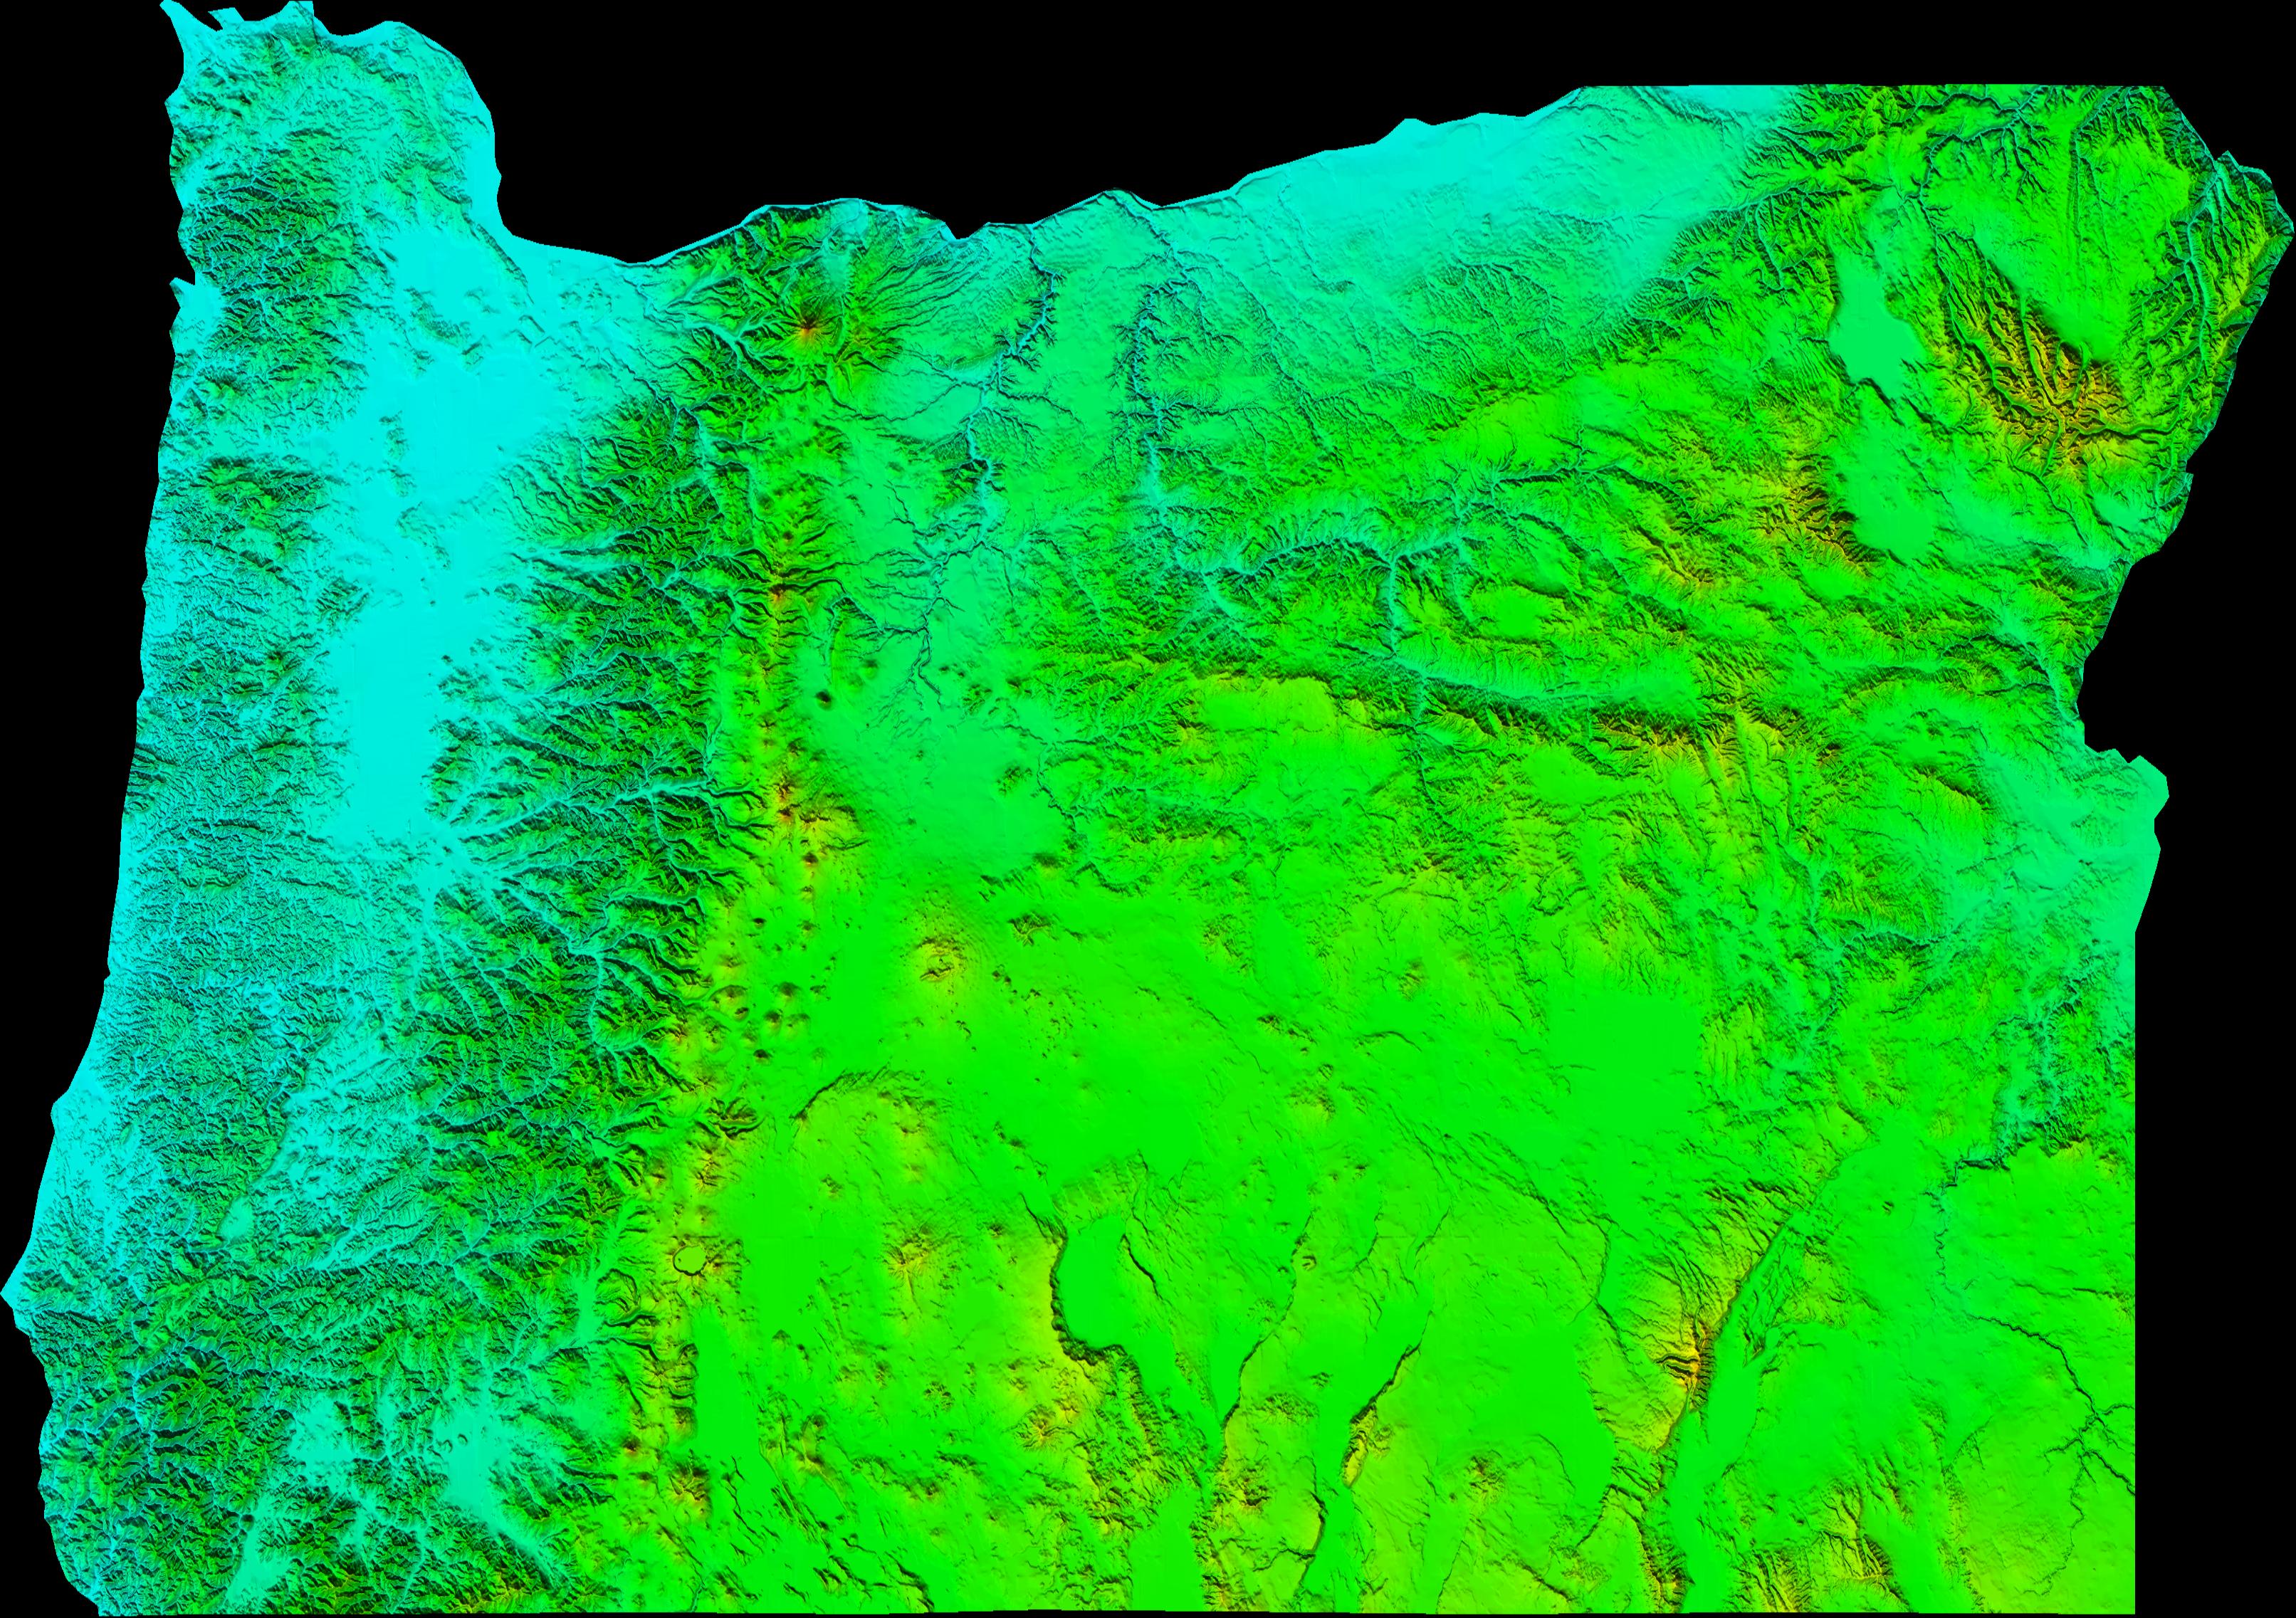
| Oregon |

|
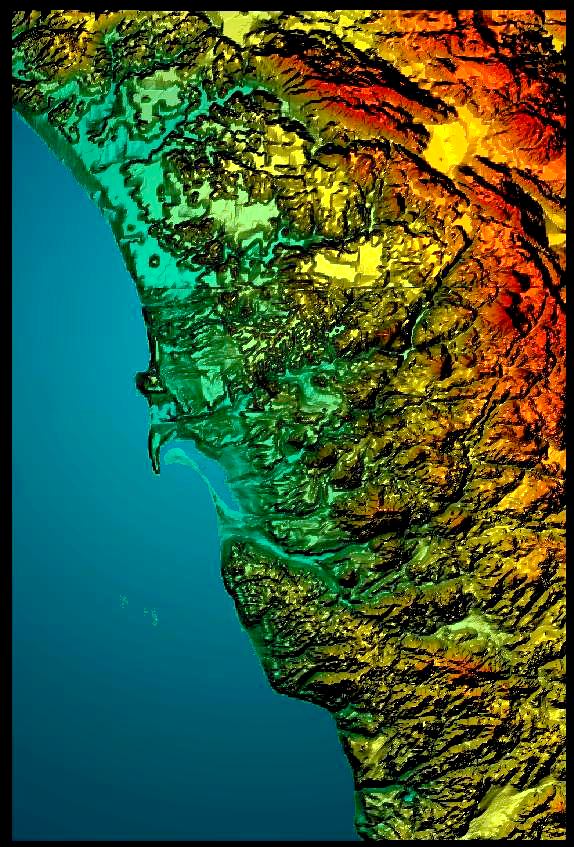
| California |
|
|
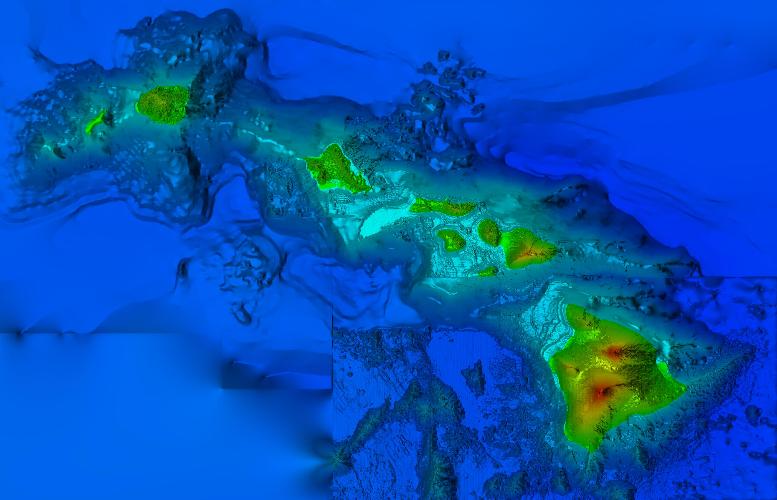
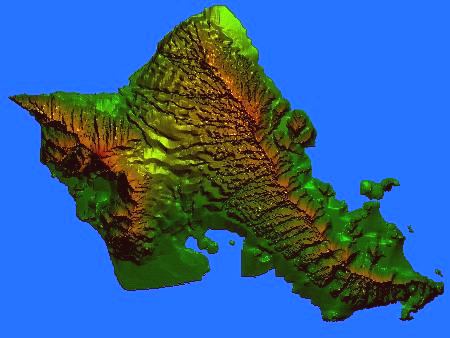
| Hawaiian Islands | Hawaiian Island of Oahu |
|
|
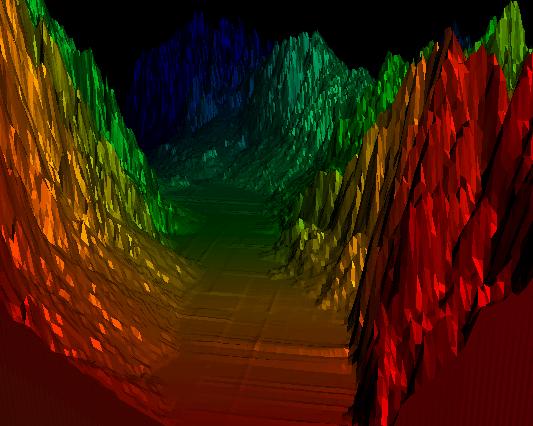
| Death Valley Earthquake Fault | Death Valley Earthquake Fault |
|
|
| Mars (Valles Marinares) | Mars (Heavily-cratered Highlands) |

|
| Sea Surface Heights (data courtesy of Detlef Stammer, SIO) |
|
| Tijuana River Watershed (data courtesy of Richard Wright and Harry Johnson, SDSU) |
|
|
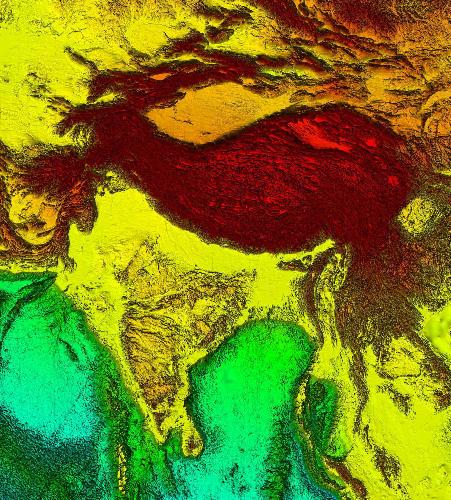
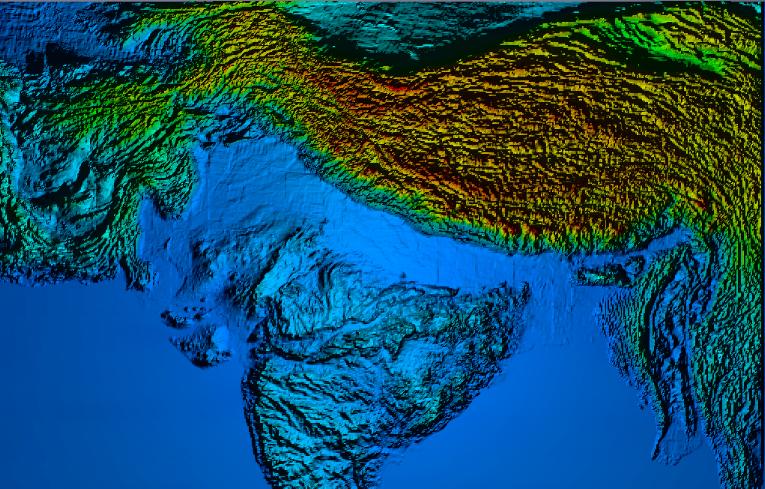
| Himalaya Mountains | Himalaya Mountains |
|
|
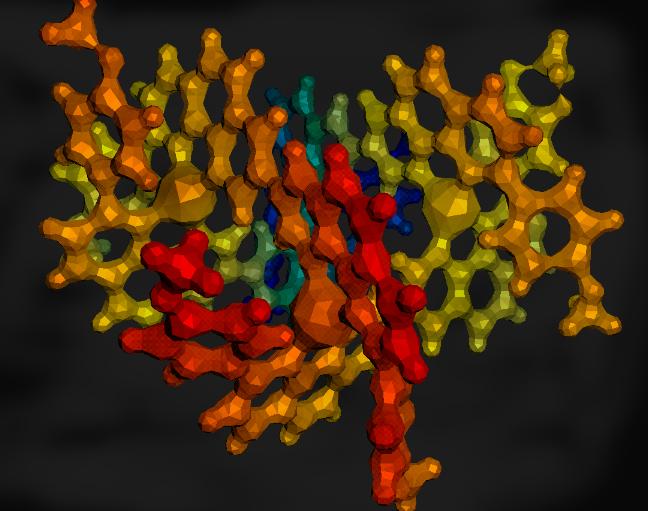
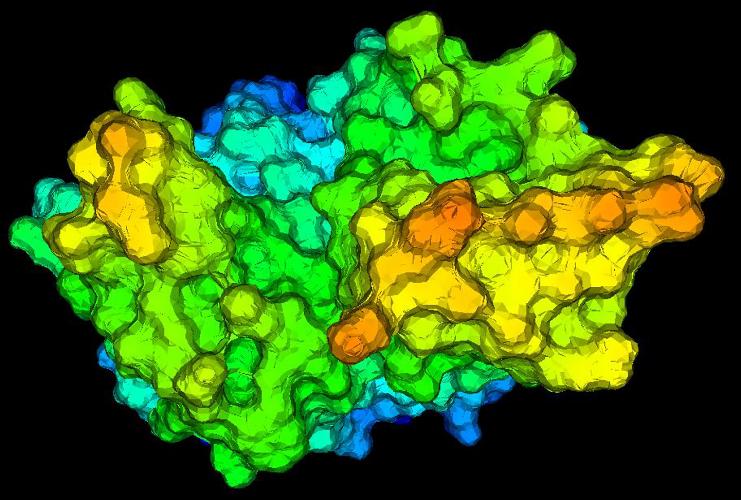
| Grid of phenanthroline | Protein Kinase Molecule |
|

|
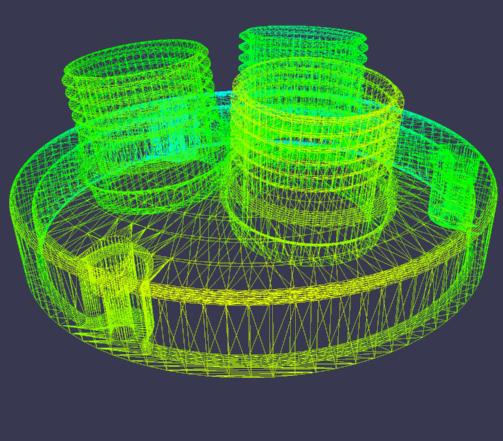
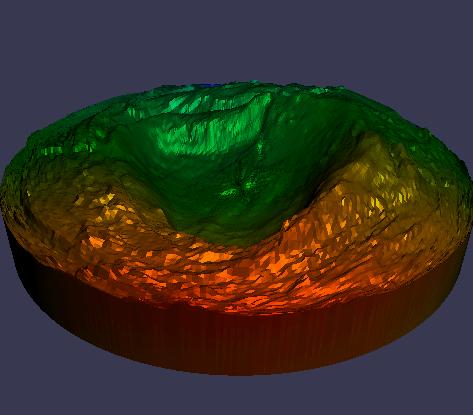
| Wireframe Lighting Lens Base | Solid Lighting Lens Base |
|
|
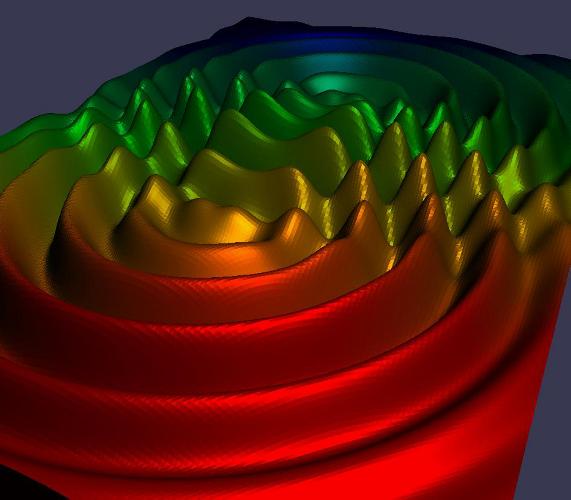
| Ozone Hole Over Antarctica | Interfering Sine Waves |
|
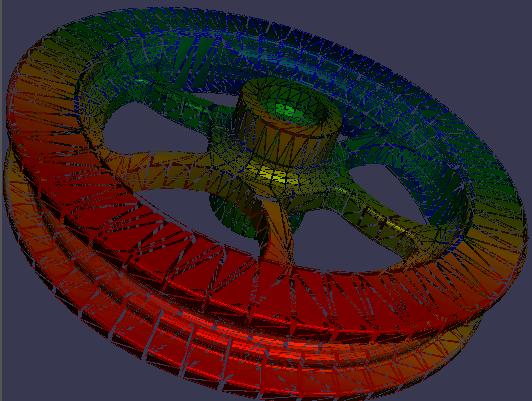
| Triangulated Pulley Wheel |

|
| Reimann Zeta Mathematical Function |
A Museum ChromaDepth Gallery Exhibit
Recently we created a ChromaDepth Image Gallery at the Reuben H. Fleet Science Center in San Diego. Show me!
ChromaDepth in Education
Congratulations to La Costa Canyon High School's Anna Wilder:
NSTA Science Teacher of the Year Finalist
Contact Information
Mike Bailey
Professor, Computer Science
3D Graphics, Scientific Visualization
Oregon State University
2117 Kelley Engineering Center
Corvallis, OR 97331-5501
541-737-2542 FAX: 541-737-1300
mjb@cs.oregonstate.edu
http://cs.oregonstate.edu/~mjb