This page was last updated: October 19, 2006
Using OpenDX:
If this doesn't work, just email me your .net and .ppt files as attachments.
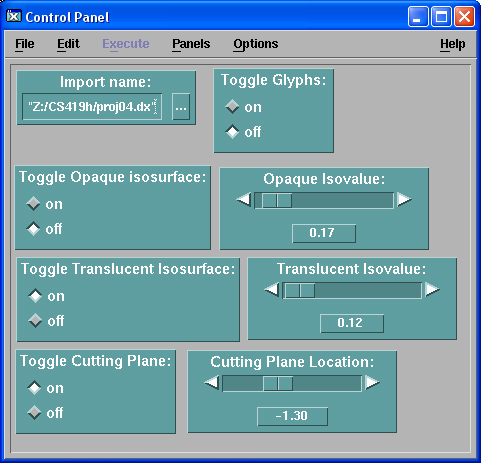
You will initially have all of these visualization elements in the scene together. For +5 points Extra Credit, create Interactor buttons to toggle each on and off. Each element should be able to be toggled independently.
To do this, you will need Toggle and Switch modules to do this. These are shown in Page 60 of the class OpenDX notes. They are also described in the OpenDX User Reference Manual.
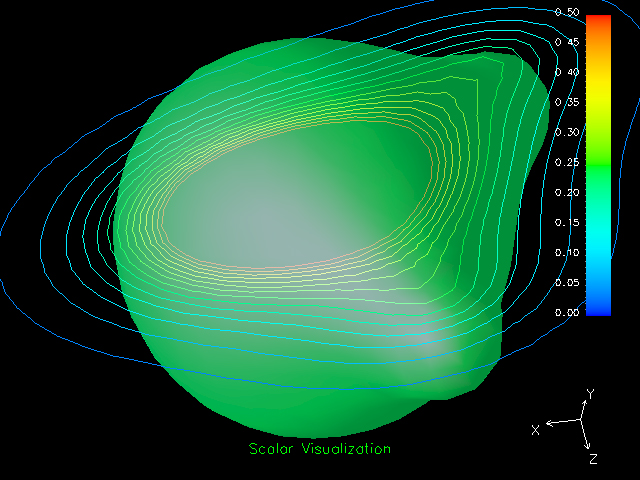
Create Interactors to slide the cutting plane perpendicular to its normal.
To do this, you will need to provide the MapToPlane module with a 3-element vector giving the (x,y,z) location a point on the plane. Good values of x and y are 0. What about z?
One thing to do is read z from a Scalar slider. But, then how to combine it into a 3-element vector? OpenDX has a very cool module called Compute which lets you create arbitrary equations in the middle of a network.
Connect the scalar into the first input of Compute. Internally, this is called "a". Set the output of compute to the string: "[0.,0.,a]"
The square brackets create a vector. Send this vector into the second input of MapToPlane.
Compute is mentioned on Page 50 of the class OpenDX notes. It is also described in the OpenDX User Reference Manual.
| Item | Points |
| Good ColorMap | 20 |
| Correct glyph display | 20 |
| Correct opaque isosurface | 30 |
| Correct translucent isosurface | 30 |
| Correct isovalue sliders | 25 |
| Correct contoured cutting plane | 25 |
| Toggle Button Extra Credit | 5 |
| Cutting Plane Interaction Extra Credit | 5 |
| Potential Total | 160 |