CS 419H -- Fall Quarter 2006
Project #5: Vector Visualization
150 Points
Due: Monday, November 6
This page was last updated: October 26, 2006
Requirements:
Using OpenDX:
-
Make all Interactors live in a single window.
-
Read proj05.dx into the Import module.
This is a 25x14x8-point 3D grid of vector data.
Its coordinates range from (0,0,0) to (104167,31000,58153)
You will need to know this when hunting for good locations to start
the streamlines.
-
Create a display of vector glyphs to give a general sense of what the data looks like.
-
Use the ColorMap module to assign colors to the full range of data.
You can use whatever color range you think looks good.
Be sure that it follows the any-two-colors rule.
-
Create a ColorBar for the colors used in the vector glyphs.
Give it an appropriate label.
(Look farther down in the ColorBar module parameters for this.)
-
Create a single streamtube (a Streamline that gets routed through Tube).
Control the diameter of the streamtube with a Scalar.
Control the starting location of the streamtube with a Vector.
Get the limits on the Vector correct (see above) before moving on
to the next step.
-
Instead of a single streamtube, now change it to a Grid of streamtubes.
Grid is a module that creates a lattice of points.
Unbeknownst to you (so far), the Streamline module can actually
take a list of points to use as streamline starting locations, not just one.
Grid is the way to make that happen.
The tabs on Grid are:
- The point to generate the grid around.
Make this changeable with an interactor.
This is a good use for a Vector module.
- What type of grid you want.
Click on the "..." to select one.
Personally, I like brick.
- Vectors showing how much to offset the grid points from each other.
Experiment with this.
A decent starting value might be:
{ [3000 0 0] , [0 3000 0] , [0 0 3000] }
- The number of grid points to generate in each dimension.
Again, try different things.
A decent starting value might be:
{ 3 , 3 , 3 }
-
Create an isosurface of the curl (curvature, vorticity) of the vector field.
The curl that comes out of the DivCurl module is actually a vector field.
Use the OpenDX Compute module to turn it into a scalar field for Isosurface.
Connect the curl into the first input of Compute.
Internally, this is called "a".
Set the output of Compute to the string: "mag(a)"
to output a scalar field that is the magnitude of the curl vector field.
-
Have a Scalar interactor control the isovalue.
Have the color of the isosurface depend on its isovalue.
Use a grayscale color range.
Use another Scalar to control the isosurface's opacity.
-
Create a second ColorBar for the colors used in the isosurface.
Give it an appropriate label.
Make it not collide with the glyph-color ColorBar.
-
Create a Caption.
Make the caption orange (Go, Beavs).
-
Create a new PowerPoint presentation file:
- Put your name, course, and project number (and any other decoration you want) on the first slide.
- Put a picture of your network on the second slide.
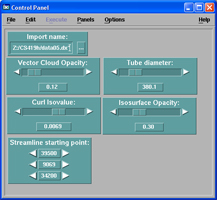
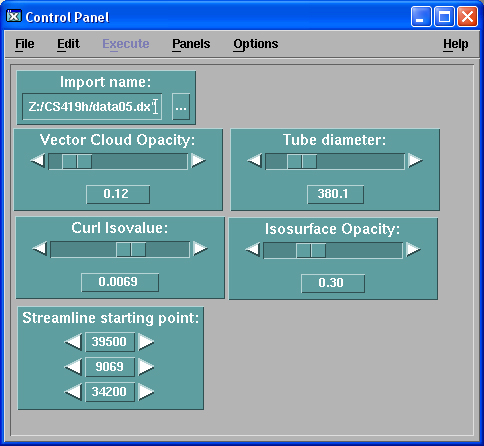
- Put a picture of your Interactor window on the third slide.
- Put a picture of the image window on the fourth slide.
-
Name your .net and .ppt files to be some form of your last name or login.
For example, Joe Graphics might name his jgraphics05.ppt and jgraphics05.net.
Upload your .net and .ppt files to Project05 to the
Teach area.
If this doesn't work, just email me your .net and .ppt files as attachments.
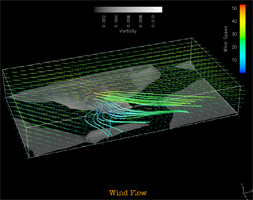
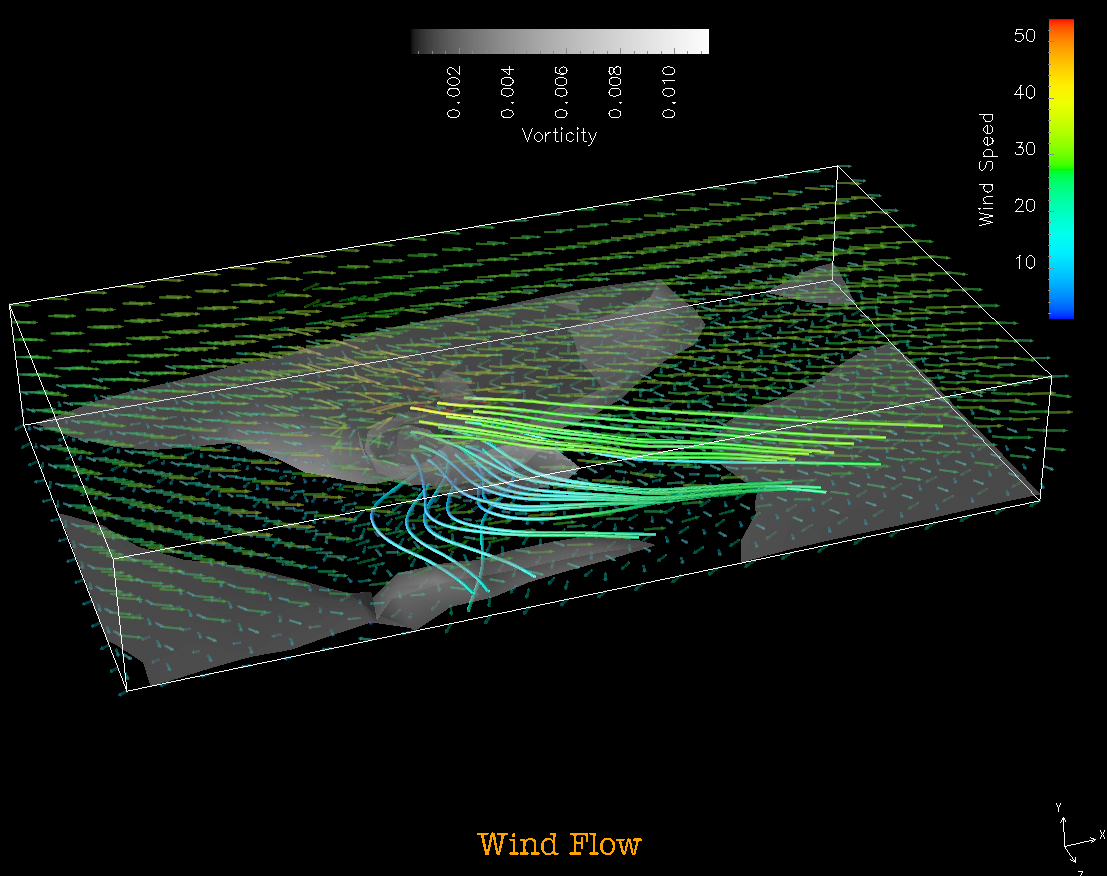
Why Use the Grid of Starting Points?
As you will see, this is a very "busy" flow field.
It is hard to really get a characterization of what is going on from just
a single streamline.
See the
sample image
to see why this is true.
+5 Points Extra Credit
You will initially have all of these visualization elements in the scene together.
For +5 points Extra Credit, create Interactor buttons to toggle each on and off.
Each element should be able to be toggled independently.
+5 Points Extra Credit
Do something interesting with a cutting plane.
It can show any scientifically-interesting quantity you want.
It can use interpolated colors or contours (or both).
It must be able to be moved with an interactor.
Grading:
| Item | Points |
| Good glyph ColorMap | 20 |
| Correct glyph display | 20 |
| Glyph ColorBar | 10 |
| At least one correct streamtube | 20 |
| Correct Grid of streamtubes | 30 |
| Curl isosurface and sliders | 30 |
| Correct isosurface ColorBar | 10 |
| Correct Caption | 10 |
| Toggle Button Extra Credit | 5 |
| Cutting Plane Interaction Extra Credit | 5 |
| Potential Total | 160 |