CS 419H -- Fall Quarter 2006
Project #6: Volume Visualization
100 Points
Due: Wednesday, November 15
This page was last updated: November 7, 2006
Requirements:
Using OpenDX:
-
Make all Interactors live in a single window.
-
Read proj06.dx into the Import module.
This is a 73 x 42 x 38 point 3D grid of scalar data.
It is a downsampled version of the Visible Human head you saw
in the graphics lab.
-
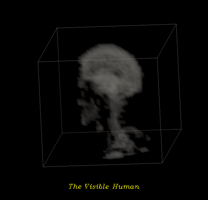
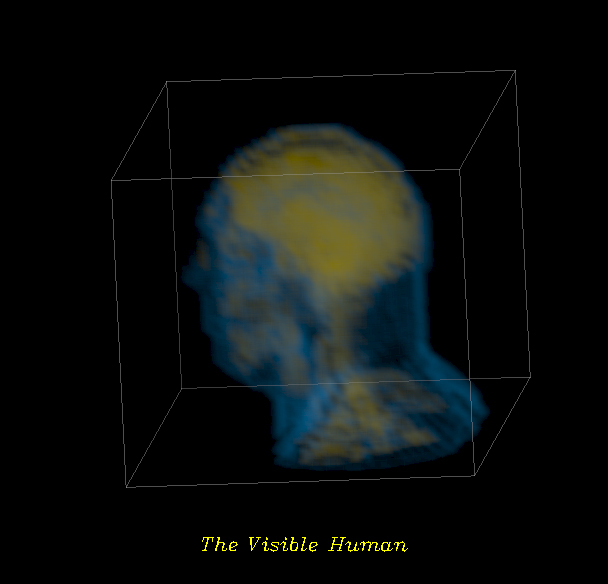
Create a volume rendering display of this data.
Set the opacity to get rid of the smallest data values, which represent
the air surrounding the head.
-
You are to create two displays, one showing skin and brain,
and one showing bone.
Use the ColorMap module to assign colors.
Each display can use different colors if you want.
-
Create a ColorBar for the colors in each display.
(Note that the sample images below don't have colorbars so that they
don't give away the color settings to you.)
-
Create a bounding box around the volume using ShowBox.
Color it white.
Control its opacity with a slider.
-
Create a Caption.
Make the caption yellow.
-
Create a new PowerPoint presentation file:
- Put your name, course, and project number (and any other decoration you want) on the first slide.
- Put a picture of your network on the second slide.
- Put a picture of your Interactor window on the third slide.
- Put a picture of the image window #1 on the fourth slide.
- Put a picture of the image window #2 on the fifth slide.
-
Name your .net and .ppt files to be some form of your last name or login.
For example, Joe Graphics might name his jgraphics06.ppt and jgraphics06.net.
Upload your .net and .ppt files to Project06 to the
Teach area.
If this doesn't work, just email me your .net and .ppt files as attachments.
Grading:
| Item | Points |
| Skin and brain display | 40 |
| Skull display | 40 |
| Colorbar | 10 |
| Bounding box | 10 |
| Potential Total | 100 |