
CS 453/553 -- Spring Quarter 2019
Project #1: Simple Grayscale Point Cloud
40 Points
Due: April 8
This page was last updated: April 2, 2019
You have run a temperature simulation of a 3D room that has 4 heat sources. You are given the temperature data from the simulation at each node in a 3D grid. 5ou will be creating several visualizations (in Projects 2, 3, 4, and 5) 5o understand the distribution of temperatures within the 3D room.
The number of data points you place within this region will be up to you.
The temperatures defined by the equation actually go
higher than 100 degrees in places, but don't worry about it.
After computing t, you can just clamp it to 100.:
const float TEMPMIN = {   0.f };
const float TEMPMAX = { 100.f };
. . .
if( t > TEMPMAX )
	t = TEMPMAX;
#define NX	???
#define NY	???
#define NZ	???
const float GRAYMIN = { 0.20f };
const float GRAYMAX = { 1.00f };
. . .
if( t > TEMPMAX )
	t = TEMPMAX;
float gray = GRAYMIN + ( GRAYMAX - GRAYMIN ) * ( t - TEMPMIN ) / ( TEMPMAX - TEMPMIN );
glColor3f( gray, gray, gray );		// r = g = b gives gray
I am going to let you "cheat" on the scalar data. Instead of reading it from a file as would normally be done, compute a scalar temperature value at each node point in each plane according according to a function included in your sample.cpp code called Temperature( x, y, z ); Pass in the x, y, z of where your node is located and it will pass back the temperature there.
If you are comfortable with structures, a 3D array of structures is
a good way to store and access the data for this project:
struct node
{
        float x, y, z;          // location
        float t;                // temperature
	float rgb[3];		// the assigned color (to be used later)
        float rad;              // radius (to be used later)
        float grad;             // total gradient (to be used later)
};

struct node  Nodes[NX][NY][NZ];
If you are not comfortable with C structures, a 3D array for X, a 3D array for Y, etc. will work too.
The InitGraphics( ) function is a good place to set all these values. Fill the (x,y,z) components of each structure in the 3D array, and use those (x,y,z) to compute a temperature.
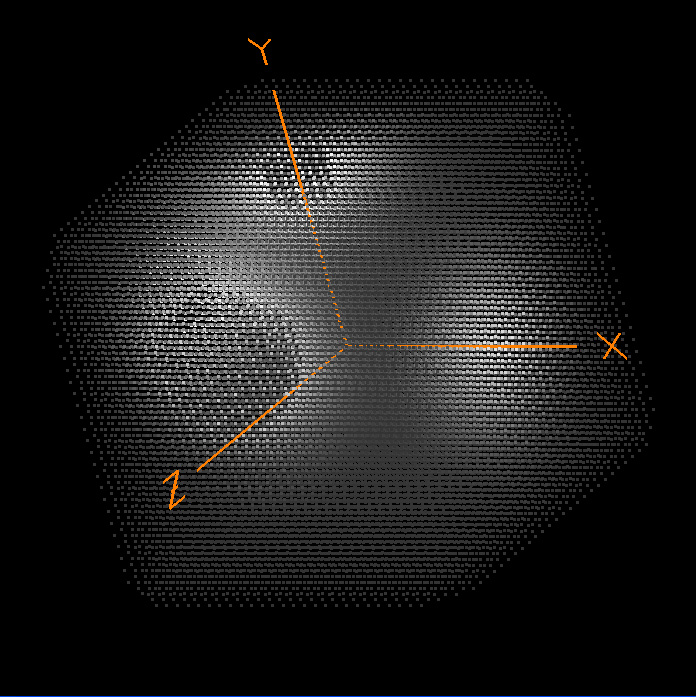
Turn-in a PDF report with a couple of images showing the intensity distribution in your point cloud.
| Item | Points |
| Correct points display | 20 |
| Correct grayscale distribution | 20 |
| Potential Total | 40 |