This page was last updated: April 24, 2019
-1.0 ≤ x,y,z ≤ 1.0
The number of divisions you use in this region is up to you. You might want to parametrize this with "#defines" or "const ints".
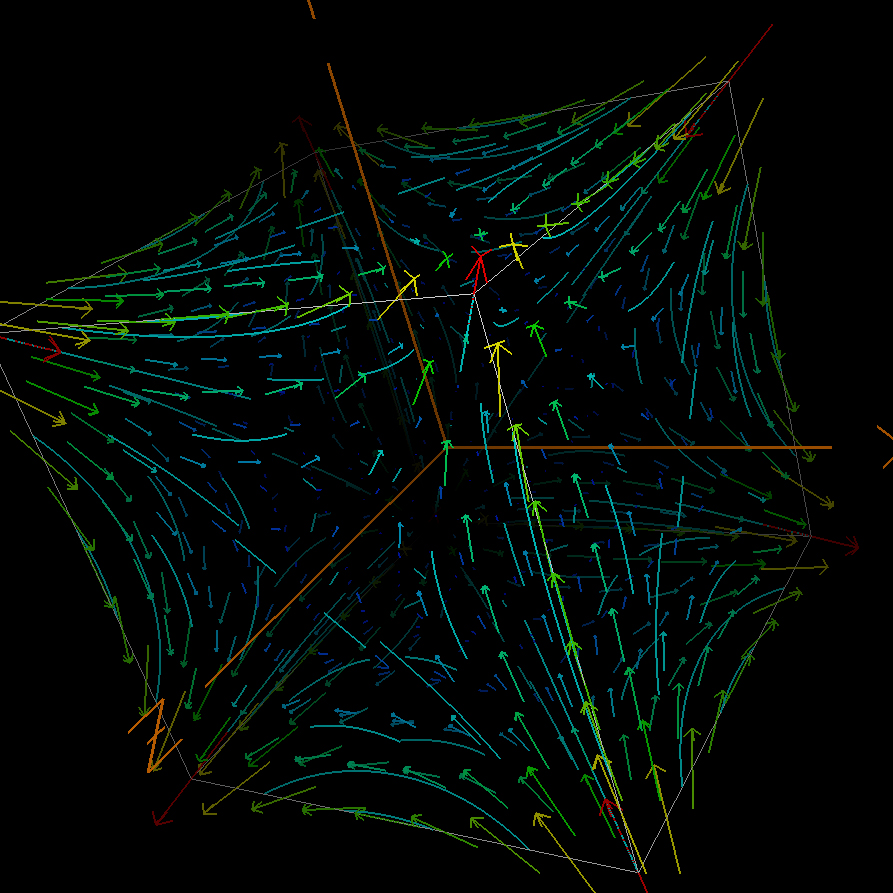
Vx(x,y,z) = y * z * ( y2 + z2 )
Vy(x,y,z) = x * z * ( x2 + z2 )
Vz(x,y,z) = x * y * ( x2 + y2 )
A C function to do this is:
void
Vector( float x, float y, float z,   float *vxp, float *vyp, float *vzp )
{
	*vxp = y * z * ( y*y + z*z );
	*vyp = x * z * ( x*x + z*z );
	*vzp = x * y * ( x*x + y*y );


}
So that its calling sequence would be:
float x, y, z;
float vx, vy, vz;
. . .
Vector( x, y, z,   &vx, &vy, &vz );
A function to compute the curl is:
float
CurlFunc( float x, float y, float z )
{
        float dvxdy = 3.*y*y*z + z*z*z;
        float dvxdz = 3.*y*z*z + y*y*y;
        float dvydx = 3.*x*x*z + z*z*z;
        float dvydz = 3.*x*z*z + x*x*x;
        float dvzdx = 3.*x*x*y + y*y*y;
        float dvzdy = 3.*x*y*y + x*x*x;

        float cx = dvzdy - dvydz;
        float cy = dvxdz - dvzdx;
        float cz = dvydx - dvxdy;

        return sqrt( cx*cx + cy*cy + cz*cz );
}
void	Arrow( float [3], float [3] );
	. . .
float tail[3], head[3];
	. . .
Arrow( tail, head );
The 3D arrow is drawn entirely with calls to glBegin( GL_LINE_STRIP ), glVertex3f( ), and glEnd( ), so the appearance of the arrow will be governed by the current transformation matrix, the current line color, and the current line width.
| Item | Points |
| Correct arrow cloud display | 25 |
| Arrow cloud scaling | 25 |
| Range slider to show vector speed | 25 |
| Range slider to show vector curl | 25 |
| Potential Total | 100 |
The equation being used for this project describes flow through a solenoid.