
CS 453/553 -- Spring Quarter 2019
Project #7: ParaView Terrain Visualization
100 Points
Due: May 22
This page was last updated: May 9, 2019
This must be done with ParaView.
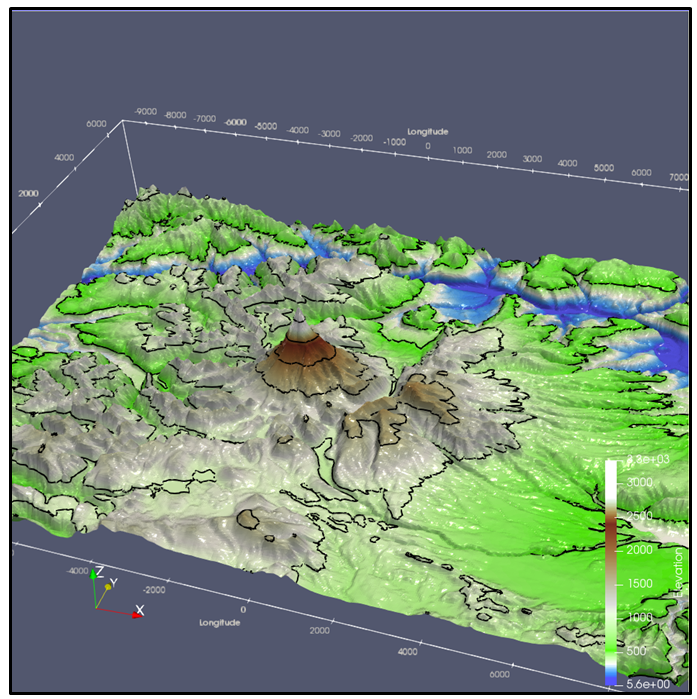
The Mount Hood terrain data is available in the file terrain.csv. It has 512 values in the X direction, 361 values in Y, and 1 value in Z.
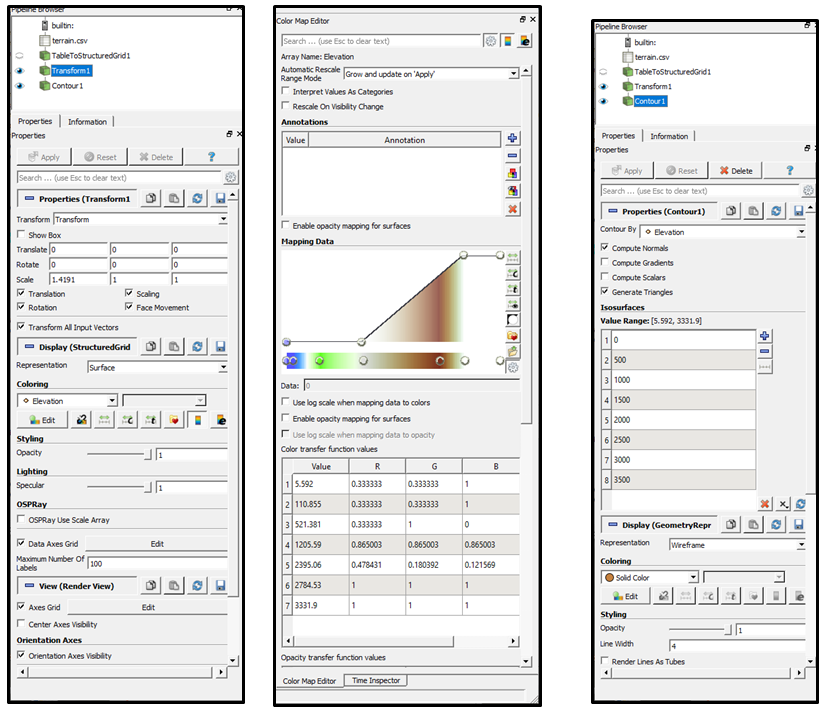
Its TableToStructuredGrid properties will look like:
| 0 | 511 |
| 0 | 360 |
| 0 | 0 |
| UTMx512 |
| UTMy361 |
| Z |
Note that the data columns Elevation and Z are replicas of each other. This is so that you can use Z for the z-coordinate and Elevation for the coloring. (You could have also replicated this yourself using the Calculator.)
You can use this dataset, or supply your own.
The Terrain Visualization portion of the ParaView notes are on slides 94 - 103.
The Choosing Colors portion of the ParaView notes are on slides 27- 33.
The Saving Images and Stereographics portions of the ParaView notes are on slides 110 - 117.
Your turn-in will be a PDF report showing images of the following:
You don't need to create a video for this project.
| Item | Points |
| Correct terrain surface | 30 |
| Informative height exaggeration | 20 |
| Good choice of transfer function | 10 |
| Brown/Blue and White sections | 10 |
| Contours | 30 |
| Potential Total | 100 |