CS 453/553 -- Spring Quarter 2019
Project #8: ParaView Volume Visualization
80 Points
Due: May 29


This page was last updated: May 10, 2019
Scenario:
This must be done with ParaView.
Using the
scalar.csv
file as input,
perform three different volume renderings:
- Compositing
- Isovolume
- Isovolume with Shrinking
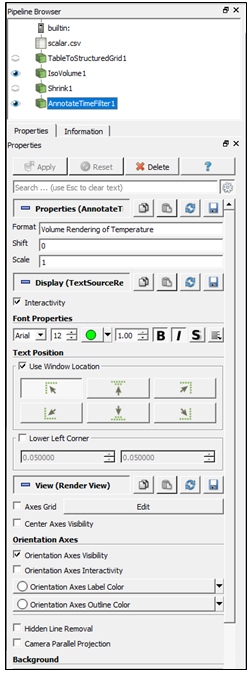
Its TableToStructuredGrid properties will look like:
and:
You can use this dataset, or supply your own.
Requirements:
-
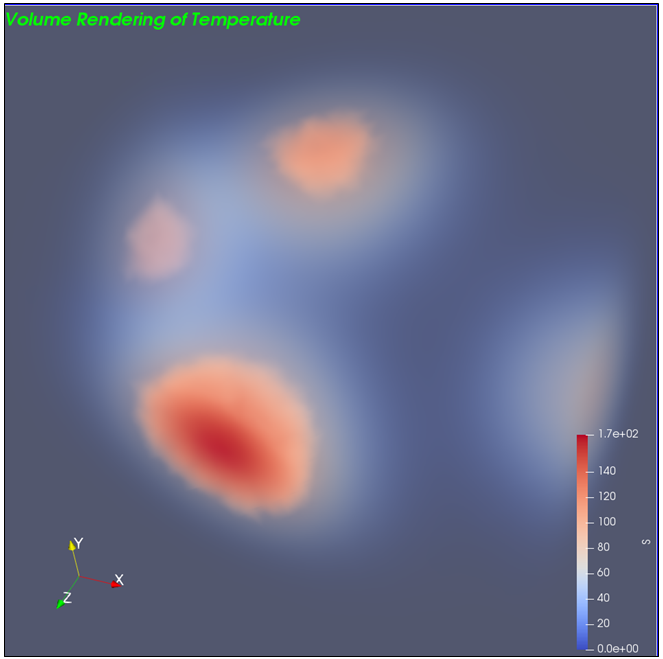
Display the data as a 3D composite.
For Display Representation, use Volume
Pick a "good" color transfer function and tell me why you chose it.
Adjust the alpha portion of the transfer function to make the low temperature values barely visible
and the high values very visible.
-
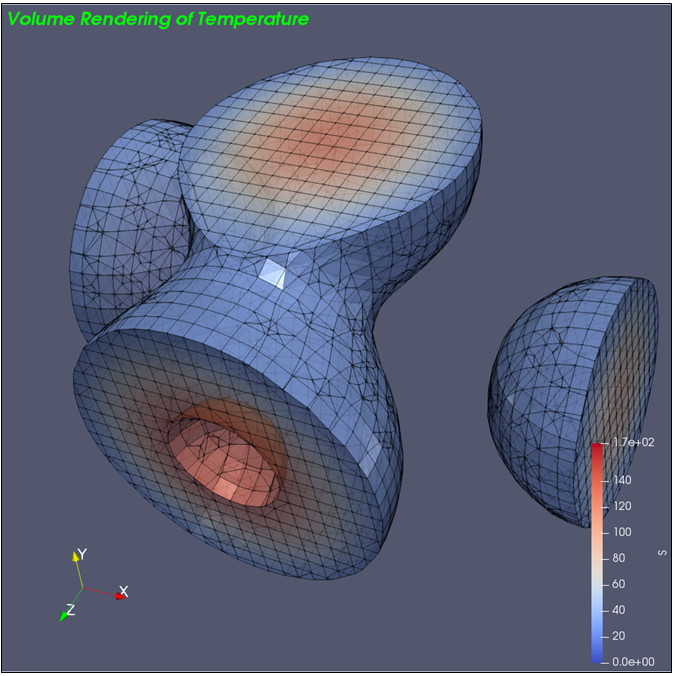
Using the same data, use an IsoVolume filter.
For Display Representation, use Surface With Edges
.Adjust the Minimum and Maximum sliders
to get rid of most of the low values and some of the very high values.
Use the same transfer function as before.
-
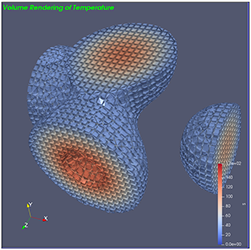
Using the IsoVolume output, hook in a Shrink filter.
For Display Representation, use Surface or Surface With Edges.
Use the same transfer function as before.
Adjust the Shrink Factor to something you think looks good.
-
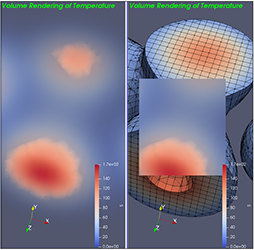
Using the AnnotateTimeFilter filter, place some appropriate title on the images.
-
Create a multidisplay showing two of the three displays you just created
(you can pick which two).
Create a "magic lens" of one inside the other.
ParaView Notes
The Volume portion of our ParaView notes are on slides 54-58.
The Annotation portion of our ParaView notes are on slides 59-62.
The Multiple Views portion of our ParaView notes are on slides 63-68.
The Turn-in:
Your turn-in will be a PDF report showing images of the following:
- Images showing the 4 required displays with annotation
- What color transfer function did you use and why.
(There is no right or wrong answer here, I am just curious why you chose what you chose.)
- If you used your own data, tell me about it!
What is it?
Where did it come from?
What are using it to show?
You don't need to create a video for this project.
Grading:
| Item | Points |
| Correct composite volume rendering | 25 |
| Correct isovolume rendering | 25 |
| Correct shrink rendering | 20 |
| Correct multiple view rendering | 25 |
| Annotation | 5 |
| Potential Total | 100 |