SIMULATING WITH SPECTRES
4. Setting up the simulation:
4.1 Provide stimulus:
From analogLib, get your signal source. You can find anything
you need for this project (and much more), in there: vdc, idc, vpwl, vsin, vpulse, etc. For
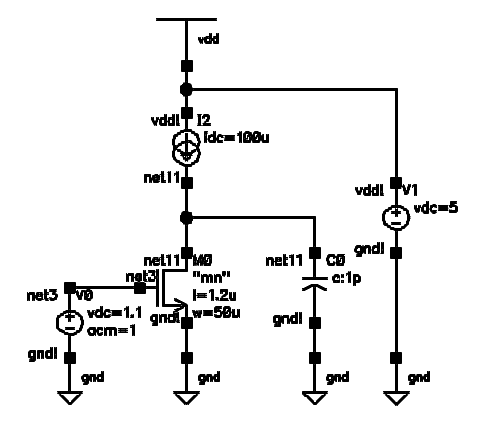
this example, let's get vdc, and connect it to the gate of the transistor.
Edit the properties of vdc so that it supplies a DC voltage of
770 mV, and an AC magnitude of 1 V.
4.2 Place a battery in the circuit:
Get another vdc from analogLib, and connect it to vdd! and gnd!. You can
place more vdd! and gnd! symbols since they are global (that's what
the exclamation mark '!' means).
Edit the properties of vdc so that it supplies a DC voltage of 5 V.
Your schematic should now look something like this:

Figure 4.1: Schematic ready for simulation.
5. Simulate:
In Schematic Window:
Design->Check and Save
There should be no errors. Warnings such as "Solder dot
on cross over" are okay.
Tools->Analog Artist
In Analog Artist Simulation Window:
The following two steps only need to be done for this first session.
Setup->Simulator/Directory/Host
Set the simulator to SpectreS.
Setup->Environment
Select 'Include/Stimulus File Syntax' as spectre, and
type './spectre.init' for the 'Include File'.
Set Analysis:
Analyses->Choose
Select dc analysis
Click "dc operating point"
Select ac analysis
Choose sweep range, from 1 kHz to 1 GHz.
Choose sweep type "logarithmic, 10 points per decade.
Click OK.
Choose nodes to be saved:
Outputs->Save all, click 'OK'.
Start simulation:
The simulator status can be seen in the log (CIW) window. Ignore the
warnings about the model files, and wait until it finishes.
6. View Results
To see the operating point, do the following in
the Analog Artist Simulation Window:
Results->Annotate->DC Node Voltages.
The node voltages will be annotated in the schematic window.
You can also annotate the transistors operating points by choosing:
Results->Annotate->DC Operating Points.

Figure 2: DC operating point results.
To see the results of the ac analysis, do the following:
In the Analog Artist Simulation Window:
Then, in the Calculator:
Click the "vf" button, click on output net in schematic.
Click "plot".
The Waveform Window opens. You can find, for example, the unity
gain frequency easily by choosing:
Markers->Horizontal Marker
Type 1 Volt in "Marker locations", and click "Apply". If you want to see the
exact value, click "Display Intercept Data".
You can also see the output voltage in dB. Just click the
'dB20' button in the calculator, and then 'Plot'. To delete
other plots, click directly on the curve and press Delete.

Figure 3: AC analysis results


