This page was last updated: April 16, 2019
For each original Cartesian coordinate pair (x,y):
int   Npts[68];
float X[68][263];
float Y[68][263];


<< in InitGraphics( ): >>

FILE *fp = fopen( "proj04.dat", "r" );
if( fp == NULL )
{
	fprintf( stderr, "Cannot open 'proj07.dat' !\n" );
	exit( 1 );
}

for( int i = 0; i < 68; i++ )
{
	fscanf( fp, "%d", &Npts[i] );
	for( int j = 0; j < Npts[i]; j++ )
	{
		fscanf( fp, "%f %f", &X[i][j], &Y[i][j] );
	}
}
fclose( fp );


<< In Display( ): >>

for( int i = 0; i < 68; i++ )
{
	glBegin( GL_LINE_STRIP );
	for( int j = 0; j < Npts[i]; j++ )
	{
		?????
		glVertex2f( ??, ?? );
	}
	glEnd( );
}
struct xy
{
	float x, y;
};

int        Npts[68];
struct xy *Outlines[68];


<< in InitGraphics( ): >>

FILE *fp = fopen( "proj04.dat", "r" );
if( fp == NULL )
{
        fprintf( stderr, "Cannot open 'proj07.dat' !\n" );
        exit( 1 );
}

for( int i = 0; i < 68; i++ )
{
	fscanf( fp, "%d", &Npts[i] );
	Outlines[i] = (struct xy *) malloc( Npts[i] * sizeof(struct xy) );

	for( int j = 0; j < Npts[i]; j++ )
	{
		fscanf( fp, "%f %f", &Outlines[i][j].x, &Outlines[i][j].y );
	}
}


<< In Display( ): >>

for( int i = 0; i < 68; i++ )
{
	glBegin( GL_LINE_STRIP );
	for( int j = 0; j < Npts[i]; j++ )
	{
		?????
		glVertex2f( ??, ?? );
	}
	glEnd( );
}
struct xy
{
	float x, y;
};

class Linestrip
{
  public:
	int npts;		// # of points in the line strip
	struct xy *pts;		// array of point structures

	// constructor:

	Linestrip( int n = 100 )
	{
		npts = n;
		pts = new struct xy[n];
	}


	// method to display the linestrip:

	void
	Display( )
	{
		glBegin( GL_LINE_STRIP );
		for( int i = 0; i < npts; i++ )
		{
			?????
			glVertex2f( ??, ?? );
		}
		glEnd( );
	}

};

	. . .

Linestrip  *Outlines[68];	// 68 linestrips in usa map

	. . .

<< In InitGraphics( ): >>

FILE *fp = fopen( "proj04.dat", "r" );
if( fp == NULL )
{
        fprintf( stderr, "Cannot open 'proj07.dat' !\n" );
        exit( 1 );
}

for( int i = 0; i < 68; i++ )
{
	fscanf( fp, "%d", &npts );
	Outlines[i] = new Linestrip( npts );
	for( int j = 0; j < npts; j++ )
	{
		fscanf( fp, "%f %f", &Outlines[i]->pts[j].x, &Outlines[i]->pts[j].y );
	}
}


<< In Display( ): >>

	for( int i = 0; i < 68; i++ )
	{
		Outlines[i]->Display( );
	}
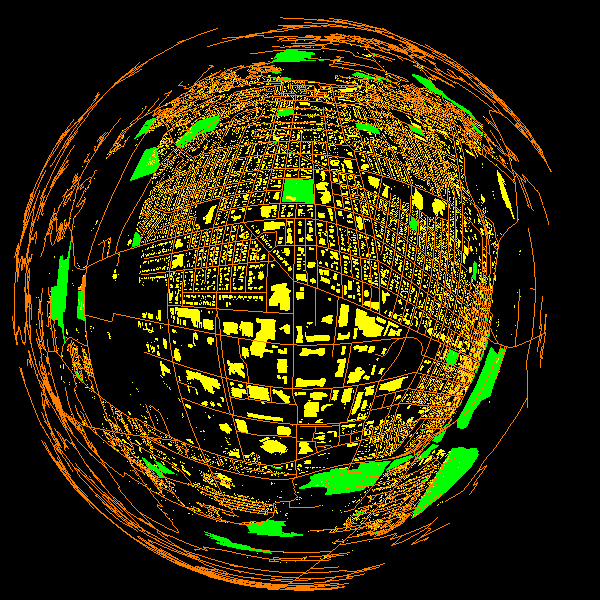
As this is a pure 2D application:
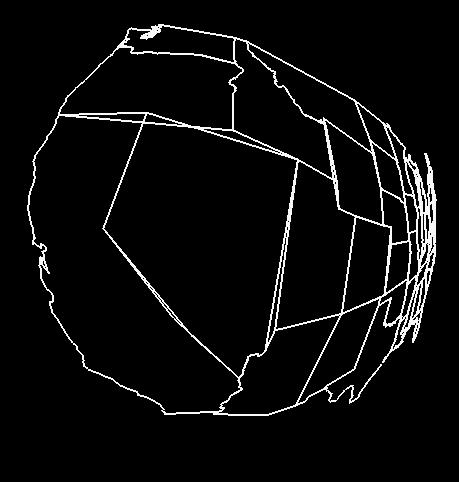
Because hyperbolic geometry uses a nonlinear equation, but we are drawing long lines, you get display cracks where there are T-intersections in the model, like this:
Break each line segment into many line segments so that long straight lines appear curved as shown here:
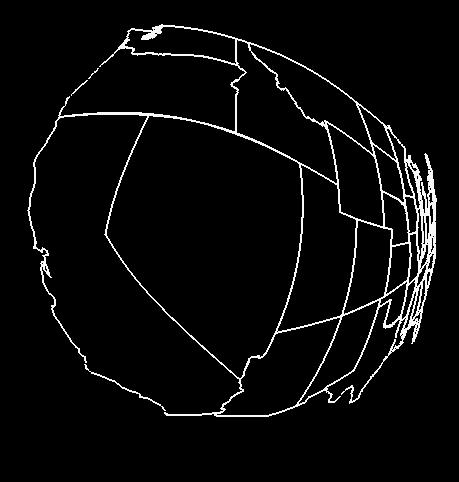
x = (1.-t) * x0  +  t * x1
y = (1.-t) * y0  +  t * y1

0. <= t <= 1.
| Item | Points |
| Draw a USA-looking map | 10 |
| Draw a correct Polar USA map | 20 |
| Draw a correct Cartesian USA map | 20 |
| Translation | 10 |
| Change K with a GLUI spinner or slider | 20 |
| Extra Credit | 5 |
| Potential Total | 85 |