CS 453/553 -- Spring Quarter 2019
Project #6: ParaView Vector Visualization
100 Points
Due: May 15

This page was last updated: May 8, 2019
Scenario:
In Project #5, you used this example vector data:
-1.0 <= x,y,z <= 1.0
Vx(x,y,z) = y * z * ( y2 + z2 )
Vy(x,y,z) = x * z * ( x2 + z2 )
Vz(x,y,z) = x * y * ( x2 + y2 )
For ParaView work, that data is available in the file
vector.csv.
Requirements:
-
Show the field using a vector cloud (arrow glyphs, in ParaView terms) to represent the
vector values at uniformly-distributed points around
the volume.
Scale the arrows to make the scene as legible as possible.
-
Color code the vectors according to their length
(ie, the speed of the field at that point).
To do this, you will have to use the calculator filter to produce a magnitude from the vector components.
The color scale is up to you.
-
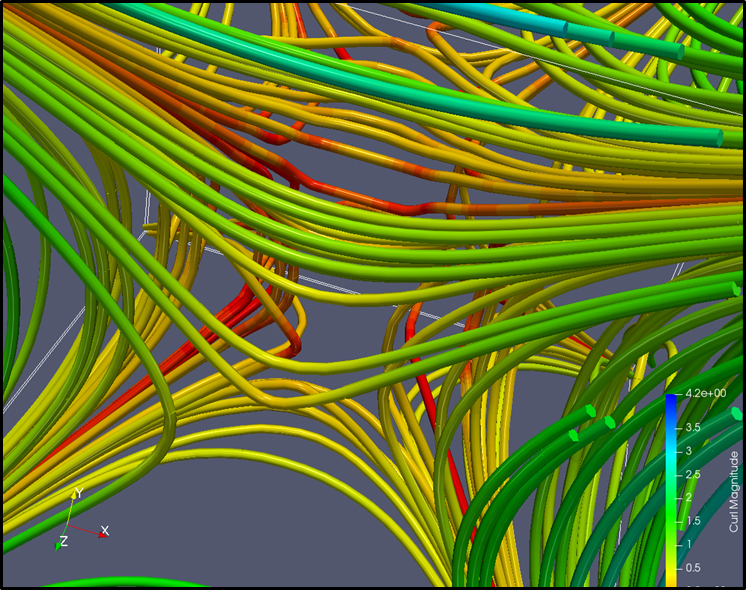
Draw streamtubes within the field starting.
-
Color the streamtubes according to the curl of the vector field.
You will need to use the
Python Calculator filter to get the curl.
Using Two Calculator Filters and One Python Ca;culator Filter
After hooking in the TableToStructuredGrid filter,
I recommend you right away add these three filters to add some new data variables into
your collection::
-
Calculator.
Create a new variable called Mag and use the equation
sqrt(Vx*Vx+Vy*Vy+Vz*Vz) -- this is the vector velocity magnitude
(speed) and will be used to color the arrow glyphs.
-
Calculator.
Create a new variable called V and use the equation
Vx*ihat+Vy*jhat+Vz*khat -- this is the 3D vector field and will
be used to create the Stream Traces.
-
Python Calculator.
Create a new variable called CURL and use the equation
curl(V) -- this is the Curl (curvature) of the vector field and will
be used to color the streamtubes.
The Turn-in:
Your turn-in will be a PDF report showing images of the following:
- Your arrow display, with correct color coding
- Your streamtube display, with correct curl color coding
- What color transfer functions did you use to use and why?
There is no right or wrong answer here, I am just curious why you chose what you chose.
- If you used your own data, tell me about it!
What is it?
Where did it come from?
What are using it to show?
You don't need to create a video for this project.
+5 Points Extra Credit
Using one (or more) of your vector visualizations, generate stereopairs.
I have a handheld stereoviewer you can use to try the stereopair images out in.
Use
this PowerPoint slide
to lay your images on, then print the page, and cut them out.
Bring them to my office.
ParaView Notes
The Vector Visualization portion of the ParaView notes are on slides 80 - 93.
The Choosing Colors portion of the ParaView notes are on slides 27- 33.
The Saving Images and Stereographics portions of the ParaView notes are on slides 110 - 117.
Grading:
| Item | Points |
| Correct arrows | 25 |
| Colored by magnitude | 25 |
| Correct streamtubes | 25 |
| Colored by curl | 25 |
| Stereographics EC | 5 |
| Potential Total | 105 |
Where In The World Did That Equation Come From?
The equation being used for this project describes flow through a solenoid.