Table 1 shows the percentage accuracy obtained in predicting the species of isolated leaves. The template database for this result consisted only of isolated leaves of the six species mentioned before. The training set (i.e. the template database) was constructed with twenty isolated leaves of each species. The overall accuracy obtained for isolated leaves is 96%.
|
Species |
Total leaves |
Classified as |
Correctly
classified |
Accuracy |
||||||
|
|
AC |
AG |
AM |
AN |
QG |
QK |
||||
|
Acer
Circinatum (AC) |
40 |
40 |
0 |
0 |
0 |
0 |
0 |
40 |
100% |
|
|
Acer Glabrum
(AG) |
40 |
0 |
38 |
2 |
0 |
0 |
0 |
38 |
95% |
|
|
Acer
Macrophyllum (AM) |
40 |
2 |
0 |
35 |
0 |
3 |
0 |
35 |
88% |
|
|
Acer Negundo
(AN) |
18 |
1 |
0 |
0 |
17 |
0 |
0 |
17 |
94% |
|
|
Quercus
Garryana (QG) |
40 |
1 |
0 |
0 |
0 |
39 |
0 |
39 |
98% |
|
|
Quercus
Kelloggii (QK) |
40 |
0 |
0 |
0 |
0 |
0 |
40 |
40 |
100% |
|
|
Table
1: Predicting species of isolated leaves |
||||||||||
Table
2 shows the percentage accuracy for predicting plant species of samples from the
herbarium. The training set for this case is same as the one used above. The
test set or the unknown image set was constructed with processed digitized
samples from the herbarium. The over all accuracy in this case is 59%.
|
Species |
Total
leaves |
Classified
as |
Correctly
classified |
Accuracy |
||||||
|
|
AC |
AG |
AM |
AN |
QG |
QK |
||||
|
Acer
Circinatum (AC) |
30 |
25 |
3 |
2 |
0 |
0 |
0 |
25 |
83% |
|
|
Acer Glabrum
(AG) |
30 |
1 |
20 |
4 |
1 |
4 |
0 |
20 |
67% |
|
|
Acer
Macrophyllum (AM) |
30 |
0 |
16 |
14 |
0 |
0 |
0 |
14 |
47% |
|
|
Acer Negundo
(AN) |
8 |
1 |
4 |
1 |
2 |
0 |
0 |
2 |
25% |
|
|
Quercus
Garryana (QG) |
30 |
4 |
2 |
4 |
0 |
19 |
1 |
19 |
63% |
|
|
Quercus
Kelloggii (QK) |
20 |
2 |
3 |
4 |
0 |
3 |
8 |
8 |
40% |
|
|
Table
2: Predicting species of digitized herbarium sample images |
||||||||||
Table 3 shows the performance accuracy for predicting
plant species of isolated leaves. However, in this case, the training set
consists of leaf shapes extracted from the digitized herbarium samples. The
overall accuracy in this case is 61%.
|
Species |
Total
leaves |
Classified
as |
Correctly
classified |
Accuracy |
||||||
|
|
AC |
AG |
AM |
AN |
QG |
QK |
||||
|
Acer
Circinatum (AC) |
40 |
34 |
1 |
1 |
0 |
4 |
0 |
34 |
85% |
|
|
Acer Glabrum
(AG) |
40 |
7 |
33 |
0 |
0 |
0 |
0 |
33 |
83% |
|
|
Acer
Macrophyllum (AM) |
40 |
18 |
7 |
9 |
0 |
5 |
1 |
9 |
23% |
|
|
Acer Negundo
(AN) |
18 |
15 |
1 |
2 |
0 |
0 |
0 |
0 |
0% |
|
|
Quercus
Garryana (QG) |
40 |
3 |
2 |
0 |
0 |
32 |
3 |
32 |
80% |
|
|
Quercus
Kelloggii (QK) |
40 |
3 |
0 |
11 |
0 |
0 |
26 |
26 |
65% |
|
|
Table
3: Predicting species of isolated leaves with training templates
consisting of only herbarium sample images
|
||||||||||
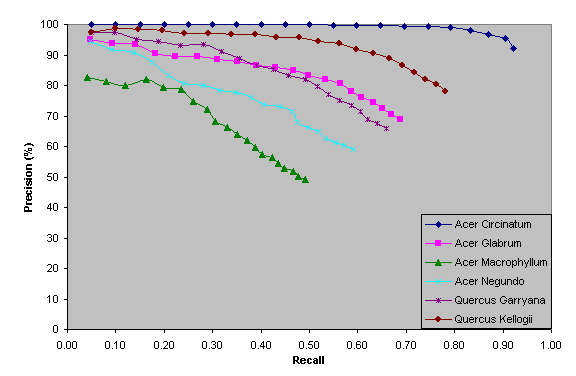
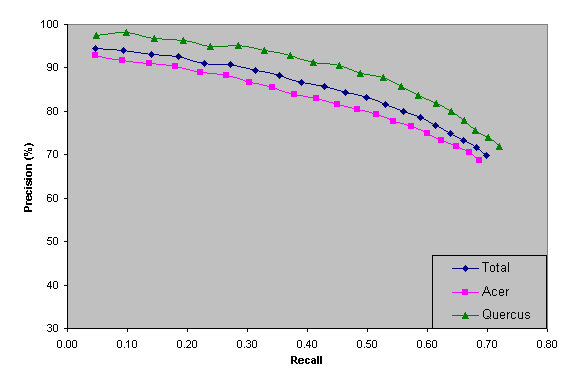
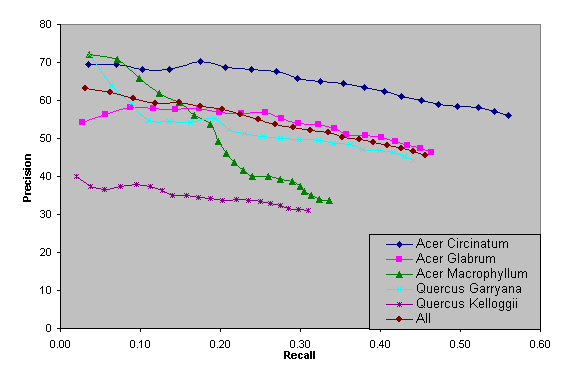
The standard measure of performance for information retrieval systems is the precision-recall plot. Consider a query to an information retrieval system (in this case, an image of an isolated leaf). We can view the information retrieval system as computing a ranking of all the documents (i.e. herbarium samples) in the database and returning the top K most relevant documents. In our application, the user wants the most relevant documents to be the ones from the same species as the query. The “precision” of the retrieval is the percentage of the K documents that belong to the correct species. The “recall” of the retrieval is the percentage of all documents for the correct species that are included in the top K retrieved documents. There is always a precision-recall tradeoff: If the information retrieval system returns the entire set of documents, then recall will be 100%, but precision will be very low. If the system returns just one document from the correct class, then precision will be 100%, but recall will be very low. The tradeoff can be visualized by plotting precision and recall as K is increased from one to some maximum value.
Figure 1 shows the precision-recall plot for the isolated leaf classification of the six plant species individually. Figure 2 shows the curves for all species combined and the curves for all species belonging to genus Acer and Quercus. The template database consists of 20 isolated leaves of each species. For small values of recalls (i.e. small setting of K), precision is over 90%. Precision gradually decreases as K is increased.
Figure 3 shows precision in retrieving isolated leaves when herbarium samples are used for querying. Acer Negundo has been skipped in the plots because of inadequate good quality herbarium samples. Figure 4 shows the precision in retrieving herbarium samples from the database with isolated leaves used as query images. Note that the precision has been calculated only for small values of recall since the database consists of a huge collection of unfiltered boundaries from the herbarium samples. That is, the boundaries also include stems, flowers and other unwanted boundaries.
Figure 1: Precision-recall curves for isolated leaves


Figure 3: Precision-recall for retrieval of isolated leaves with herbarium samples as query

Figure 4: Precision-recall for retrieval of herbarium samples
