
CS 453 / 553 -- Scientific Visualization
Spring Quarter 2019
http://cs.oregonstate.edu/~mjb/cs553


| 
| 
| 
| 
|
| Classes | Projects | Handouts | Grades | VHR |
This page was last updated: June 14, 2019
| Windows Visual Studio 2017 | Sample2017.zip | Un-zip and double-click on the .sln file |
The worlds of science and engineering are being smothered with data.
In both simulation and sensing, datasets are becoming larger and easier to obtain.
This creates a fundamental crisis in that scientists and engineers are under pressure to be
able to understand larger amounts of data in less time, and be able to show and explain it to others.
This course will cover the fundamentals of 3D scientific and engineering multidimensional data:
how to create datasets and how to formulate them so that good visualization is possible.
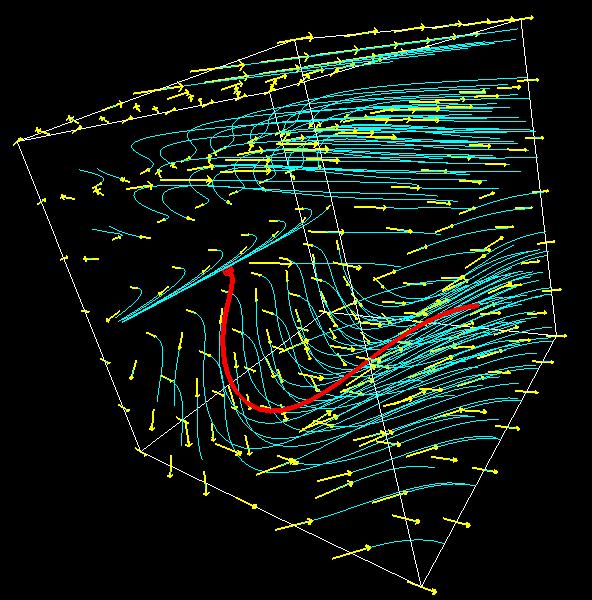
It will cover the visualization of such data using techniques such as 2D graphics,
3D graphs, contours, isosurfaces, terrains, flows, and volumes.
The class will also cover displaying time-varying data through the use of animations.
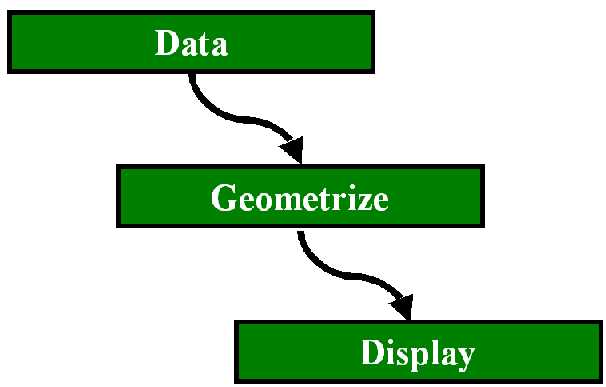
Introductory courses in computer graphics emphasize converting
geometry into a display.
In visualization, we also need to know about converting data into geometry:
The goals of this course are to leave you "career-ready"
i.e., both work-ready and research-ready)
for tasks that require 3D graphics to understand and gain insight
into complex scientific and engineering data.
We will cover a variety of topics in advanced
computer graphics and scientific/engineering visualization.
For some of the projects, we will use a free, open source, visualization package called
Paraview.
For other projects, you will write your own C/C++ OpenGL code, although you
will be given a skeleton that does all of the program "boilerplate" for you,
leaving you to do the very specific parts of the visualization.
The idea is that, at some point, you can't avoid writing your own code.
This happens when (1) what you want to do exceeds the capabilities of any of the packages
or (2) you want to integrate visualization techniques into some other piece of code.
What We Will Be Doing This Quarter
Paraview
runs on Windows desktop systems, and can be freely downloaded from.
https://www.paraview.org/download/.
There are Linux and MacOS versions of ParaView, but they are the multi-CPU flavor.
| If you need it, you will have access to the graphics systems in OSU's Computer Graphics Education Lab (CGEL) in Batcheller Hall 244. You are also free to develop the projects on other systems, including your own. |

|
If you don't have an account that already works in the CGEL, you can get one by virtue of being enrolled in this course. Go to: http://teach.engr.oregonstate.edu and click on Create a new account (Enable your Engineering resources) at the bottom of the first page (even before you login to teach).
CS 453/553 topics include:
On completion of the course, students will:
In addition, those taking this course as CS 553 will also have demonstrated the ability to:
Prerequisites
You can take this course with little or no graphics experience,
but please do not take it for credit if you are not a moderately
experienced programmer.
You don't have to know C/C++ really well to start,
but you should come in having programmed in something.
CS 453/553 is a tough way to learn to program for the first time ...
Learning Objectives
Professor
The class is being taught by
Professor Mike Bailey.
| Office: | Kelley 2117 (second floor, south side) |
| E-mail: | mjb@cs.oregonstate.edu |
| Phone: | 541-737-2542 |
| Mondays | 2:00 - 4:00 | Kelley 2117 |
| Wednesdays | 2:00 - 4:00 | Kelley 2117 |
| Thursdays | 12:30 - 2:30 | Kelley 2117 |
| or, by appointment -- send email | ||
| or, anytime my office door is open |

| 
|
| Wenbo Hou | Prof. Bailey |
| houw@oregonstate.edu | mjb@cs.oregonstate.edu |
| Mondays, 10:30 - 2:00 | Mondays, 2:00 - 4:00 |
| Tuesdays, 11:00 - 2:00 | |
| Wednesdays, 10:30 - 2:00 | Wednesdays, 2:00 - 4:00 |
| Thursdays, 12:30 - 2:30 | |
| Fridays, 2:00 - 5:00 | |
| CGEL (Bat 244) | Kelley 2117 |
I recognize that it takes a certain amount of courage to ask a question in class.
But, the worst decision of all is to not ask!
So, this class has a feature called the Virtual Hand Raise.
Click here to get into it.
It will allow you to send me a question or comment,
completely anonymously.
I will answer all questions submitted this way at the start of the next class.
The Virtual Hand Raise
| The Visualization Process | 1pp 2pp 4pp 6pp |
| Getting Started with OpenGL (from CS 450/550) | 1pp 2pp 4pp 6pp |
| Scalar Visualization | 1pp 2pp 4pp 6pp |
| Color In Visualization | 1pp 2pp 4pp 6pp |
| ParaView | Web page with notes |
| OpenGL-GLUT-GLUI | |
| Vector Visualization | 1pp 2pp 4pp 6pp |
| Hyperbolic Geometry | 1pp 2pp 4pp 6pp |
| Terrain Visualization | 1pp 2pp 4pp 6pp |
| Directly Visualizing Volume Data | 1pp 2pp 4pp 6pp |
| Using the Accumulation Buffer for Visualization | 1pp 2pp 4pp 6pp |
| Using the Stencil Buffer for Visualization | 1pp 2pp 4pp 6pp |
| Resampling Scattered Data | 1pp 2pp 4pp 6pp |
| Finding More Information | |
| Using Kaltura to record turn-in videos for class assignments |
The CGEL will be available for your use, but you can also use your own computer systems.
You can use any GLUI-GLUT-OpenGL environment you can find
(eg, Linux, Mac, Visual C++) for program development.
We take computer security very seriously.
Please use intelligently-chosen passwords and protect them.
There is no required textbook for this class.
Everything will be done with notes and web pages.
If you want to brush up on computer graphics, I recommend the OSU CS 450/550 notes,
which can be found
here.
Especially look at the Getting Started with OpenGL notes.
The OSU ParaView noteset can be found
here.
A nice ParaView Getting Started Guide can be found
here.
A nice ParaView tutorial can be found
here.
The ParaView people have made a free copy of their book available
here.
If you are dying to have the physical ParaView book, here is how to get it:
Labs
Security
Textbook

|
Utkarsh Ayachit, The ParaView Guide, Kitware, 2015.
It's available on Amazon ($77) here. |
To see an academic year calendar,
click here.
Class Schedule
Class time is:
Monday, Wednesday, and Friday, 9:00 - 9:50.
Unless otherwise specified,
all classes will be held in Kearney 112.
1
April 1
Introductions.
General course information.
The Visualization Process.
Intro to ParaView
2
April 3
Introduction to Scalar Visualization:
point clouds.
Project #1.
3
April 5
Prof. Bailey out of the office -- no class today
4
April 8
Range sliders.
5
April 10
Color:
RGB, HSV, CMYK, La*b* color spaces.
Different color scales.
Mapping scalar values to colors.
General rules of thumb when using color in
scientific and engineering visualization.
Color gamuts.
6
April 12
Scalar visualization:
colored planes and contour lines.
7
April 15
Isosurfaces.
ParaView scalar visualization.
8
April 17
ParaView scalar visualization.
9
April 19
ParaView scalar visualization.
ParaView animation
10
April 22
Hyperbolic geometry
11
April 24
Vector visualization:
vector clouds,
particle traces,
streamlines,
line traces, ribbon traces, blob traces.
12
April 26
Test #1 review.
https://www.youtube.com/watch?v=iHJUmw5FCsM
https://www.youtube.com/watch?v=EgumU0Ns1YI
http://www.ncsa.illinois.edu/enabling/vis/cadens/making_of
ParaView vector visualization.
13
April 29
Optional help session: test and projects.
14
Wednesday, May 1
Test #1
15
May 3
Prof. Bailey out of the office -- no class today.
16
May 6
Go over test answers.
17
May 8
Terrain visualization.
18
May 10
Terrain visualization using ParaView.
Map projections.
19
May 13
Parallel coordinates.
20
May 15
Engineering Expo prep day.
Class today is an optional help session in Kelley room 2114.
21
May 17
Engineering Expo -- no class today
22
May 20
Volume Visualization: rendering, transfer functions, parallel texture planes, uses.
23
May 22
Volume visualization: ParaView
24
May 24
The Stencil Buffer in data visualization:
magic lenses, outlining polygons, hidden line removal.
The Accumulation Buffer in visualization: motion blur, depth of field.
25
May 27
Memorial Day -- no class today
26
May 29
The Ethics of Visualization. The difference between visualization and conceptualization.
27
May 31
Prof. Bailey out of the office -- no class today
28
June 3
Interpolated scalar values within a triangle.
Re-sampling.
Delauney Triangulation.
Voronoi diagrams.
29
June 5
Test #2 review
Class Evaluations:
it is important that you come today!
More information: books, periodicals, professional organizations, conferences.
30
June 7
Optional Help Session -- Kelley 2114
*
Thursday, June 13
Test #2
9:30 - 11:00 AM, Thursday, June 13
You can confirm this for yourself by going
here.
| Project # | Points | Title | Due Date |
| 1 | 40 | Grayscale Point Clouds | April 8 |
| 2 | 100 | Point Clouds, Colors, and Range Sliders | April 15 |
| 3 | 100 | ParaView Scalar Visualization | April 23 |
| 4 | 100 | Hyperbolic Geometry | April 29 |
| 5 | 80 | Vector Clouds with Range Sliders | May 8 |
| 6 | 100 | ParaView Vector Visualization | May 15 |
| 7 | 100 | ParaView Terrain Visualization | May 22 |
| 8 | 80 | ParaView Volume Visualization | May 29 |
| 553-Project | 100 | Roll-your own scientific visualization project | June 9 |
Where necessary, I will give you data or equations to use to generate data for the projects. What if you have some of your own data that will work for the methods being used in a particular project?
Yes! Very cool. Feel free to use it.
However, talk with me first. I want to be sure that (1) your data really is appropriate, and (2) you can import it easily so you don't spend the bulk of the time until the due date just trying to read it.
Grades will be posted through this web page.
To protect your privacy,
they will be posted by your alias that you give me in Project #1.
Click here to see the current grade posting.
CS 453/553 will be graded on a fill-the-bucket basis.
There will be 11 quizzes, ?? projects, and two tests.
You get to keep all the points you earn.
... with the exception of ...
Quiz #0 is due to me by 4:00 PM on Friday, April 5.
Fortunately, it is not too hard:
If you are taking both of my classes this quarter, please fill
out an index card for each.
Those taking the class as CS 553 will also do a roll-your-own scientific visualization project.
(Those taking the class as CS 453 will get a free 100 points for not doing this assignment.)
Your final grade will be based on your overall class point total.
Based on an available point total of 1110,
grade cutoffs will be no higher than:
Grading
The quizzes will be done via Canvas.
They will open each Friday afternoon right after class and close Sunday night at 23:59:00.
Canvas is very unforgiving about due times -- don't push it.
| Points | Grade |
| 1080 | A |
| 1050 | A- |
| 1020 | B+ |
| 990 | B |
| 960 | B- |
| 930 | C+ |
| 900 | C |
| 870 | C- |
| 840 | D+ |
| 810 | D |
| 780 | D- |
Projects are due at 23:59:59 on the listed due date,
with the following exception:
Each of you has been granted five bonus days, which are no-questions-asked
one-day extensions which may be applied to any project, subject to the following rules:
Click here
to get a copy of the Bonus Day Submission Form.
Fill this out and turn it in the next class period after turning in
your project.
Accommodations for students with disabilities are determined and approved by Disability Access Services (DAS). If you, as a student, believe you are elig
ible for accommodations but have not obtained approval please contact DAS immediately at 541-737-4098 or at
http://ds.oregonstate.edu.DAS notifies students and faculty members of approved academic accommodations and coordinates implementation of those accommodations. While not required, students and faculty members are encouraged to discuss details of the implementation of individual accommodations.
Oregon State University strives to respect all religious practices. If you have religious holidays that are in conflict with any of the requirements of this class, please see me immediately so that we can make alternative arrangements.
As {John Lennon? Allen Saunders?} has said: "Life is what happens to you while you're busy making other plans".
I care about you as a person.
When life happens to you, send me an email and come see me.
I might be able to help, I might not.
But I surely can listen.
You are not alone.
Any student who has difficulty affording groceries or accessing sufficient
food to eat every day, or who lacks a safe and stable place to live,
is urged to contact the
Human Services Resource Center (HSRC)
for support:
hsrc@oregonstate.edu,
541-737-3747.
The HSRC has a food pantry, a textbook lending program, and
other resources to help.
Furthermore, if you are comfortable doing so, please talk with me.
I will do everything I can do to help you.
Project Turn-In Procedures
You have one week after the grades are posted to do this!
Bonus Days
Class Rules
Students With Disabilities
Religious Holidays
Life Events
Basic Needs
Other Useful Online Graphics and Visualization Information